Fig. C.1.
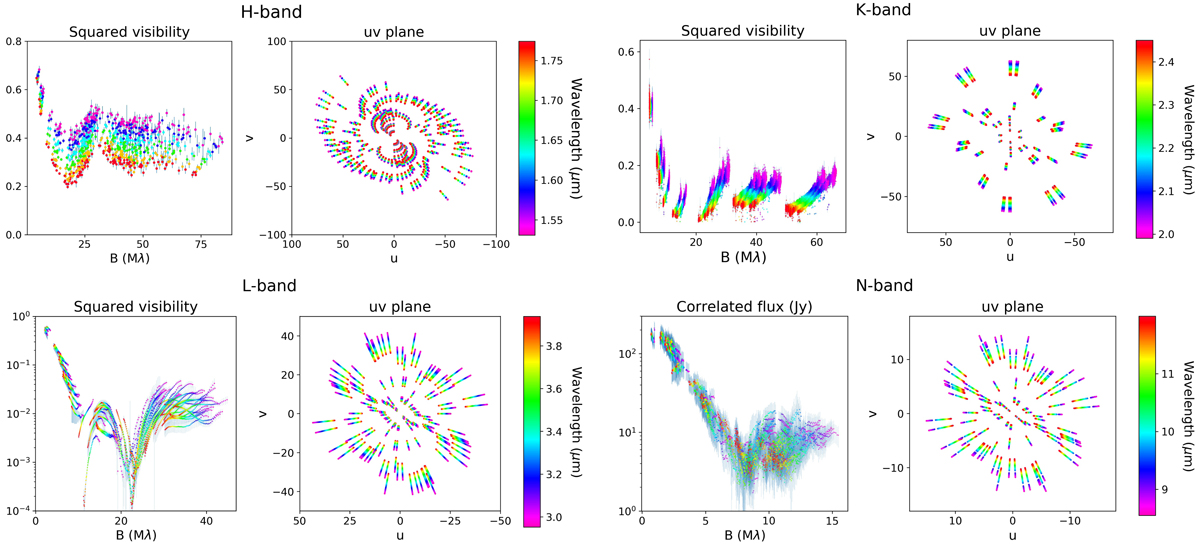
Visibility data as a function of the baseline and wavelength and the uv-coverages of the accepted data. Top left: H-band. Top right: K-band. Bottom left: L-band. Bottom right: N-band. The near-IR data show a strong chromatic effect in the squared visibilities, whereas there is a mono-chromatic effect at wavelengths at which the circumbinary disc dominates.
Current usage metrics show cumulative count of Article Views (full-text article views including HTML views, PDF and ePub downloads, according to the available data) and Abstracts Views on Vision4Press platform.
Data correspond to usage on the plateform after 2015. The current usage metrics is available 48-96 hours after online publication and is updated daily on week days.
Initial download of the metrics may take a while.