Fig. 1.
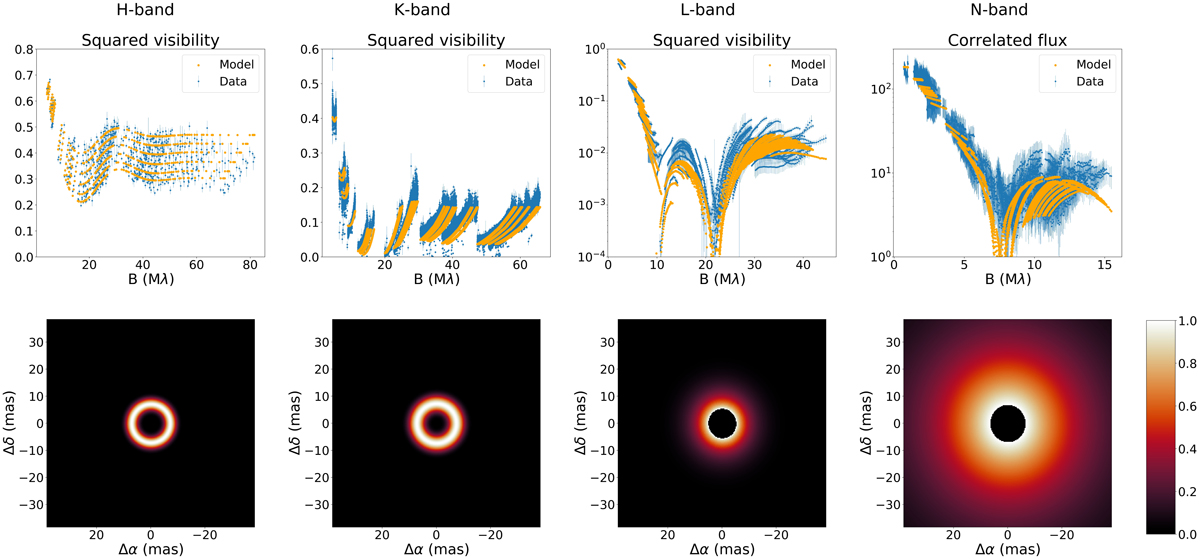
Top: visibility data of (from left to right) the H-, K-, L-, and N-band in blue and the best fitting geometric model in orange. The correlated flux measurements in the N-band are given in units of Jansky. Bottom: images of the circumbinary disc from the best fitting geometric model for each band normalised to the total flux of each individual image.
Current usage metrics show cumulative count of Article Views (full-text article views including HTML views, PDF and ePub downloads, according to the available data) and Abstracts Views on Vision4Press platform.
Data correspond to usage on the plateform after 2015. The current usage metrics is available 48-96 hours after online publication and is updated daily on week days.
Initial download of the metrics may take a while.