Fig. 1.
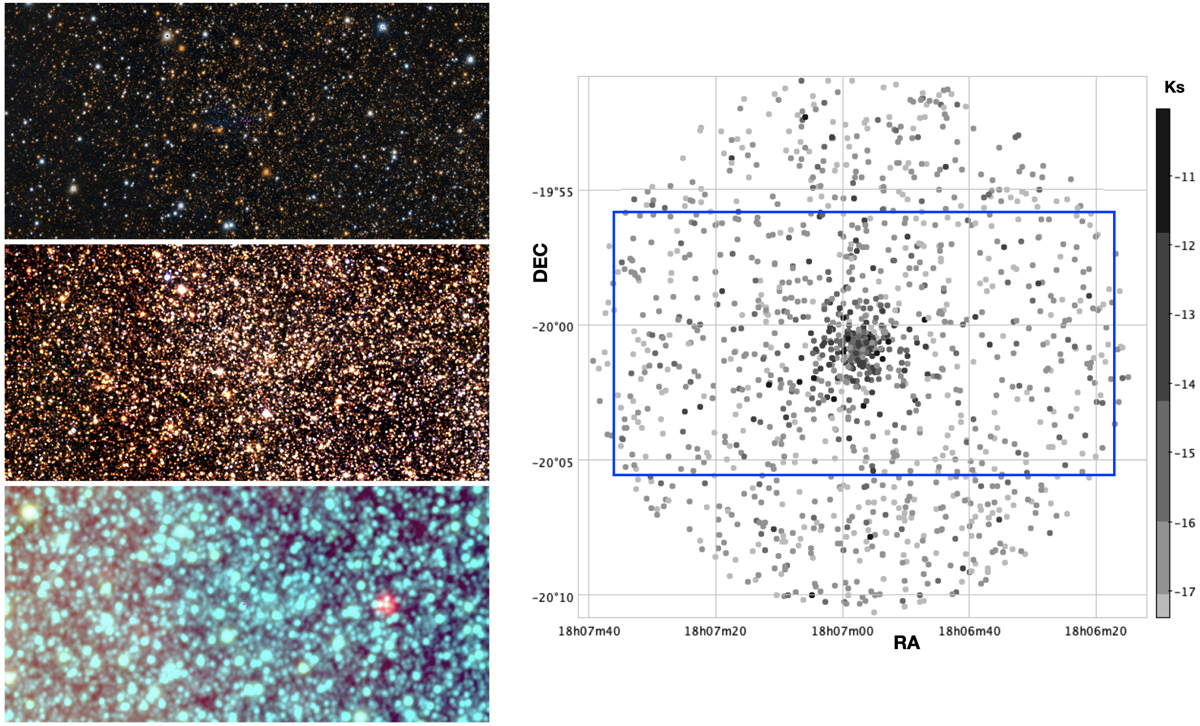
Finding charts for VVV-CL160 at different wavelengths. Left panels: field covering 10′×20′ centered on VVV-CL160 in the optical from Pan-STARRS (top), NIR from 2MASS (middle), and mid-infrared from WISE (bottom). Right panel: map showing only the PM-selected sources, with the blue rectangle showing the same field as the left panels.
Current usage metrics show cumulative count of Article Views (full-text article views including HTML views, PDF and ePub downloads, according to the available data) and Abstracts Views on Vision4Press platform.
Data correspond to usage on the plateform after 2015. The current usage metrics is available 48-96 hours after online publication and is updated daily on week days.
Initial download of the metrics may take a while.