Free Access
Fig. 4.
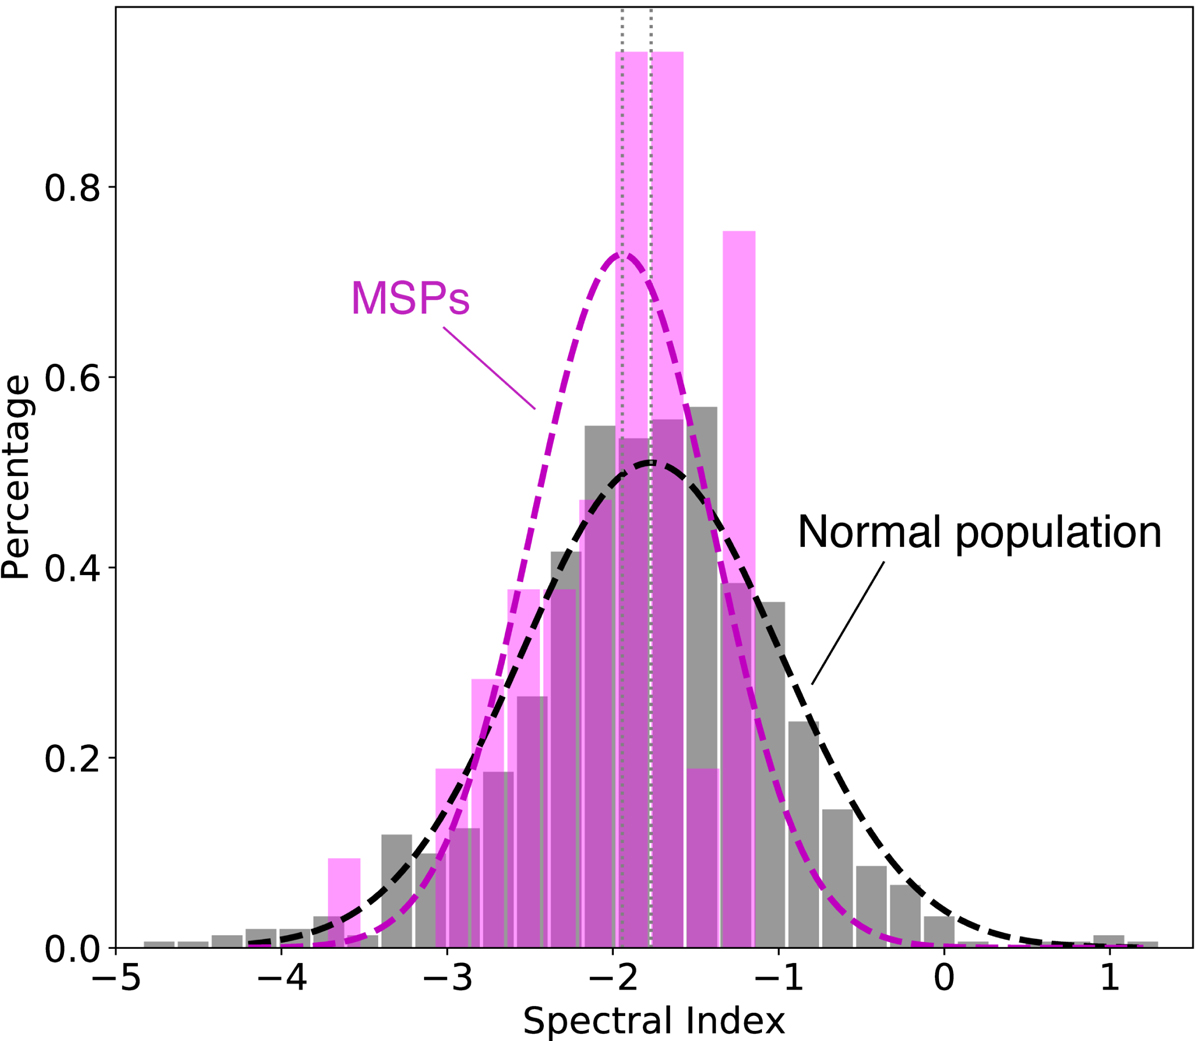
Histograms of spectral index distribution for the populations of MSPs (P ≤ 30 ms) and normal population (P > 30 ms) from the database PSRCAT v1.62 (Manchester et al. 2005). A normal distribution is fit in each case, resulting in ⟨αMSP⟩= − 1.95 ± 0.54 for the MSP-only population, and ⟨α⟩= − 1.76 ± 0.79 for the rest.
Current usage metrics show cumulative count of Article Views (full-text article views including HTML views, PDF and ePub downloads, according to the available data) and Abstracts Views on Vision4Press platform.
Data correspond to usage on the plateform after 2015. The current usage metrics is available 48-96 hours after online publication and is updated daily on week days.
Initial download of the metrics may take a while.