Fig. 3.
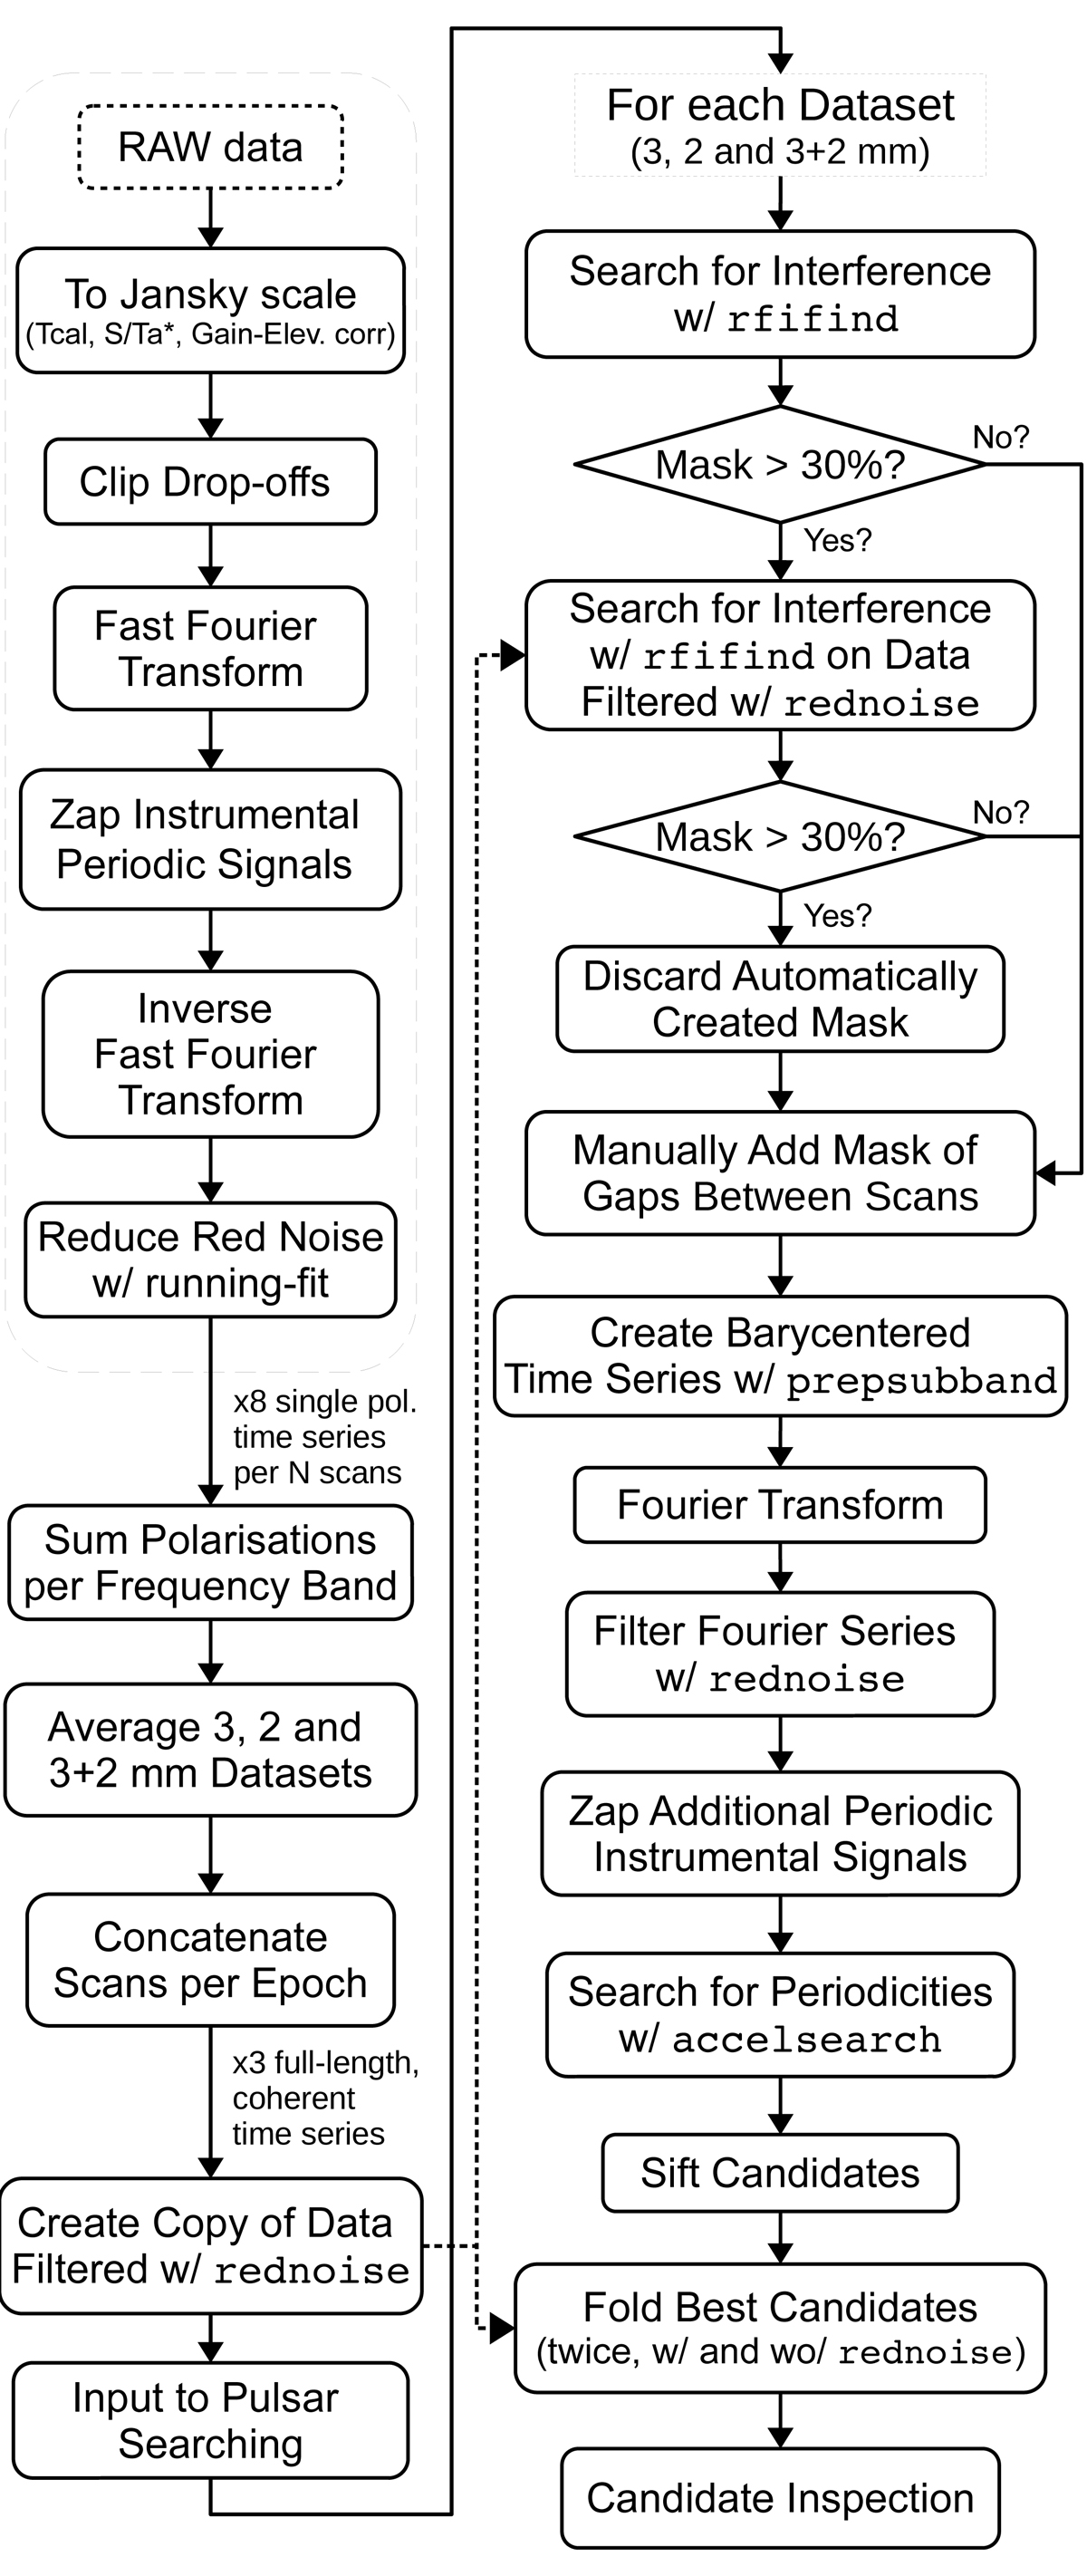
Flowchart of the data analysis as described in Sect. 3. The algorithm is applied to each observing epoch individually. The steps inside the dashed block are applied in parallel to each single-polarisation time series of each frequency band. When this block finalises, the algorithm continues to reduce the data, creating total intensity time series and averaging frequency bands to create the three datasets 3, 2, and 3+2 mm (see Sect. 3.2). These datasets then enter the searching algorithm as summarised in the right column of the diagram.
Current usage metrics show cumulative count of Article Views (full-text article views including HTML views, PDF and ePub downloads, according to the available data) and Abstracts Views on Vision4Press platform.
Data correspond to usage on the plateform after 2015. The current usage metrics is available 48-96 hours after online publication and is updated daily on week days.
Initial download of the metrics may take a while.