Fig. 5.
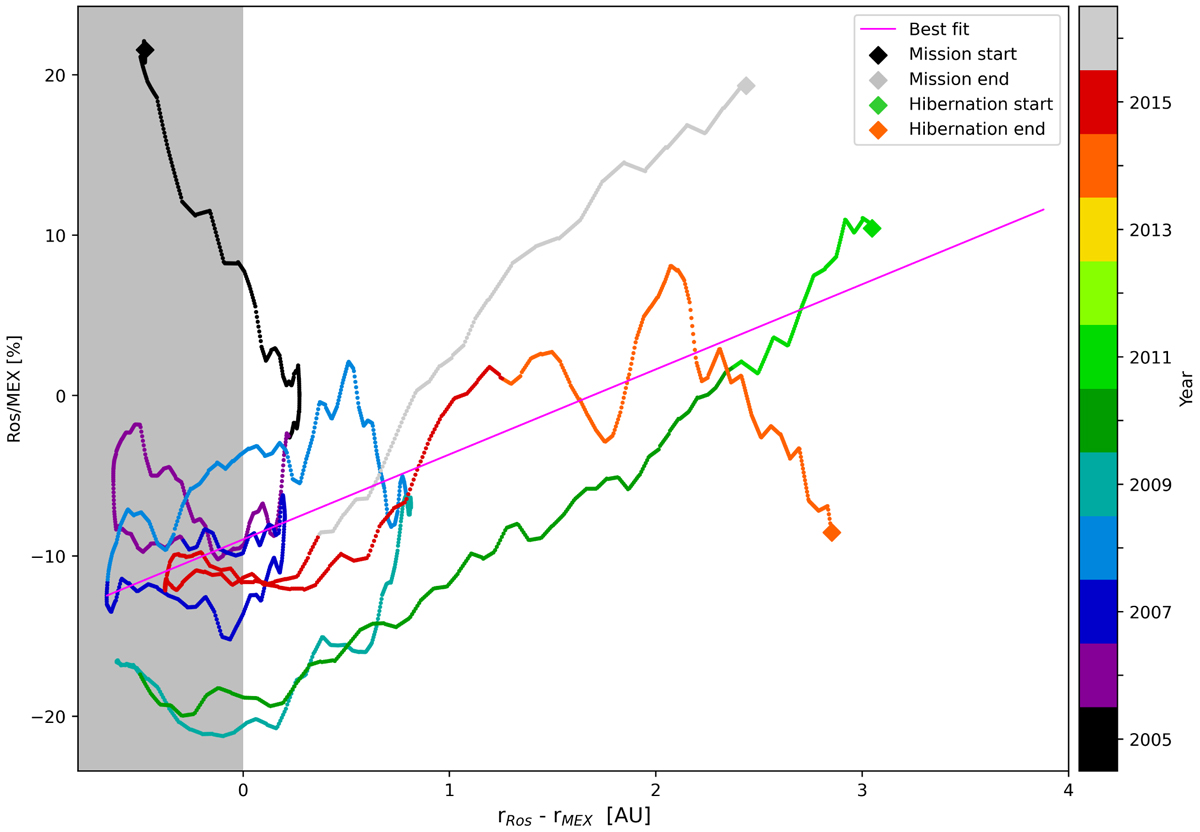
Ratio of smoothed Rosetta and MEX EDAC count rates as a function of the difference in solar distance. The magenta line indicates the linear best fit of the data, with an obtained slope corresponding to a 5.3% AU−1 increase in GCR intensity. Each colour indicates a full terrestrial year, except for 2016 (grey), which ends on September 29. The diamonds mark the start and end points of the Rosetta EDAC time series. The lightest shades of green and yellow are not present in the plot as they represent times when Rosetta was in hibernation. The grey shaded area for x < 0 indicates when Rosetta was at or within mean Martian orbit. EDAC data points within this region were not included in the best-fit procedure illustrated in the figure.
Current usage metrics show cumulative count of Article Views (full-text article views including HTML views, PDF and ePub downloads, according to the available data) and Abstracts Views on Vision4Press platform.
Data correspond to usage on the plateform after 2015. The current usage metrics is available 48-96 hours after online publication and is updated daily on week days.
Initial download of the metrics may take a while.