Fig. 4.
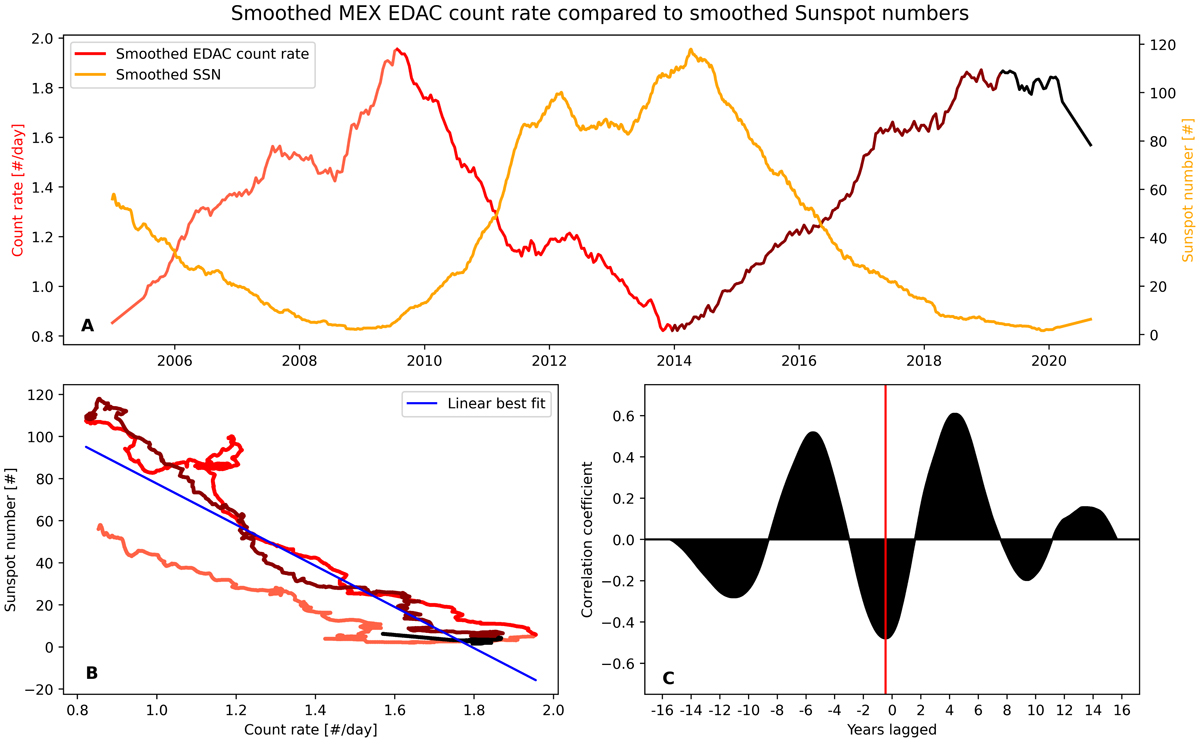
Long-term solar cycle modulation of GCRs. Panel A: smoothed SSNs in orange along with smoothed MEX EDAC count rates in hues of red. The count rate is colour-coded according to the solar cycle phases to highlight the effect of solar modulation. The colours match the colours in panel B. Panel B: SSNs as a function of MEX count rates in hues of red as defined in panel A. The blue line is the linear best fit of the data points, indicating the relationship between the two parameters. Panel C: cross-correlation between smoothed SSN and MEX count rates, illustrating a cyclic anti-correlated relationship, where the EDAC rate lags 5.5 months behind the solar cycle as measured by the SSN.
Current usage metrics show cumulative count of Article Views (full-text article views including HTML views, PDF and ePub downloads, according to the available data) and Abstracts Views on Vision4Press platform.
Data correspond to usage on the plateform after 2015. The current usage metrics is available 48-96 hours after online publication and is updated daily on week days.
Initial download of the metrics may take a while.