Fig. 1.
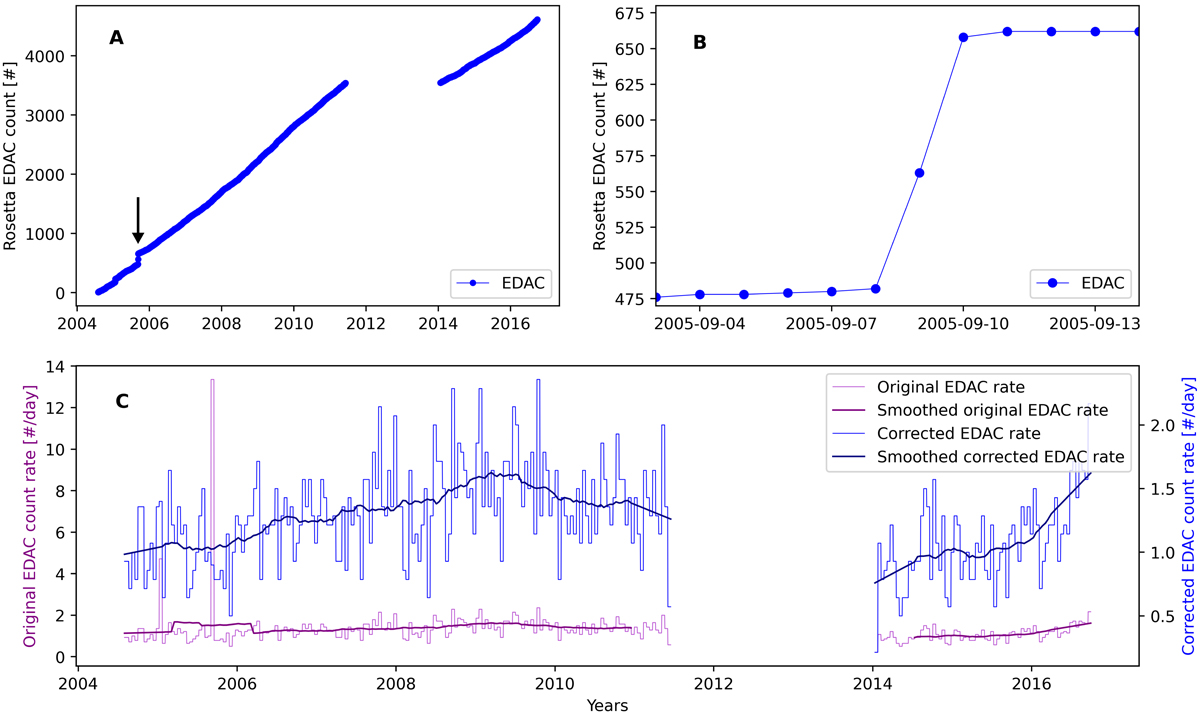
Illustration of the removal process of SEP-induced disturbances (SPEs drastically influence the EDAC counters, artificially raising the calculated EDAC count rate for several months prior to and after the actual event). Panel A: Rosetta EDAC counter from January 2005 to end of mission; the blank space indicates the hibernation period and the black arrow points to an example SEP event. Panel B: close-up of the jump indicated in panel A. Panel C: smoothed and original EDAC count rates before (purple, left y-axis) and after (blue, right y-axis) removal of two distinct SEP events. We note that the original and modified count rates are plotted on different y-scales to highlight the extreme count rate values obtained if SEP events are not removed from the time series.
Current usage metrics show cumulative count of Article Views (full-text article views including HTML views, PDF and ePub downloads, according to the available data) and Abstracts Views on Vision4Press platform.
Data correspond to usage on the plateform after 2015. The current usage metrics is available 48-96 hours after online publication and is updated daily on week days.
Initial download of the metrics may take a while.