Fig. 6
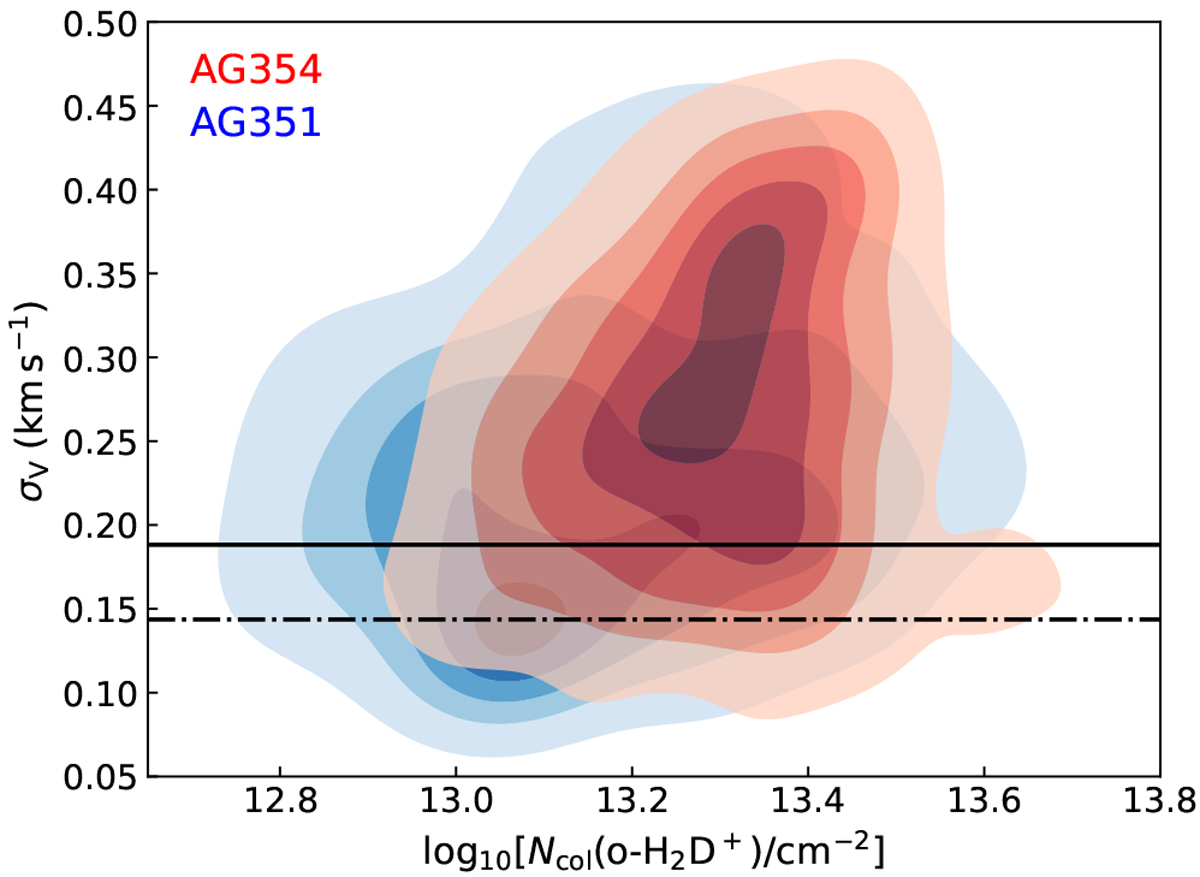
Normalised kernel density distribution of σV and Ncol in AG351 (blue) and AG354 (red) obtained from the MCWEEDS pixel-per-pixel fit. The contour levels are [0.1, 0.3, 0.5, 0.7, 0.9]. The horizontal solid line shows the sound speed at 10 K, while the dot-dashed line represents the thermal broadening of H2D+ at the same temperature.
Current usage metrics show cumulative count of Article Views (full-text article views including HTML views, PDF and ePub downloads, according to the available data) and Abstracts Views on Vision4Press platform.
Data correspond to usage on the plateform after 2015. The current usage metrics is available 48-96 hours after online publication and is updated daily on week days.
Initial download of the metrics may take a while.