Fig. 10
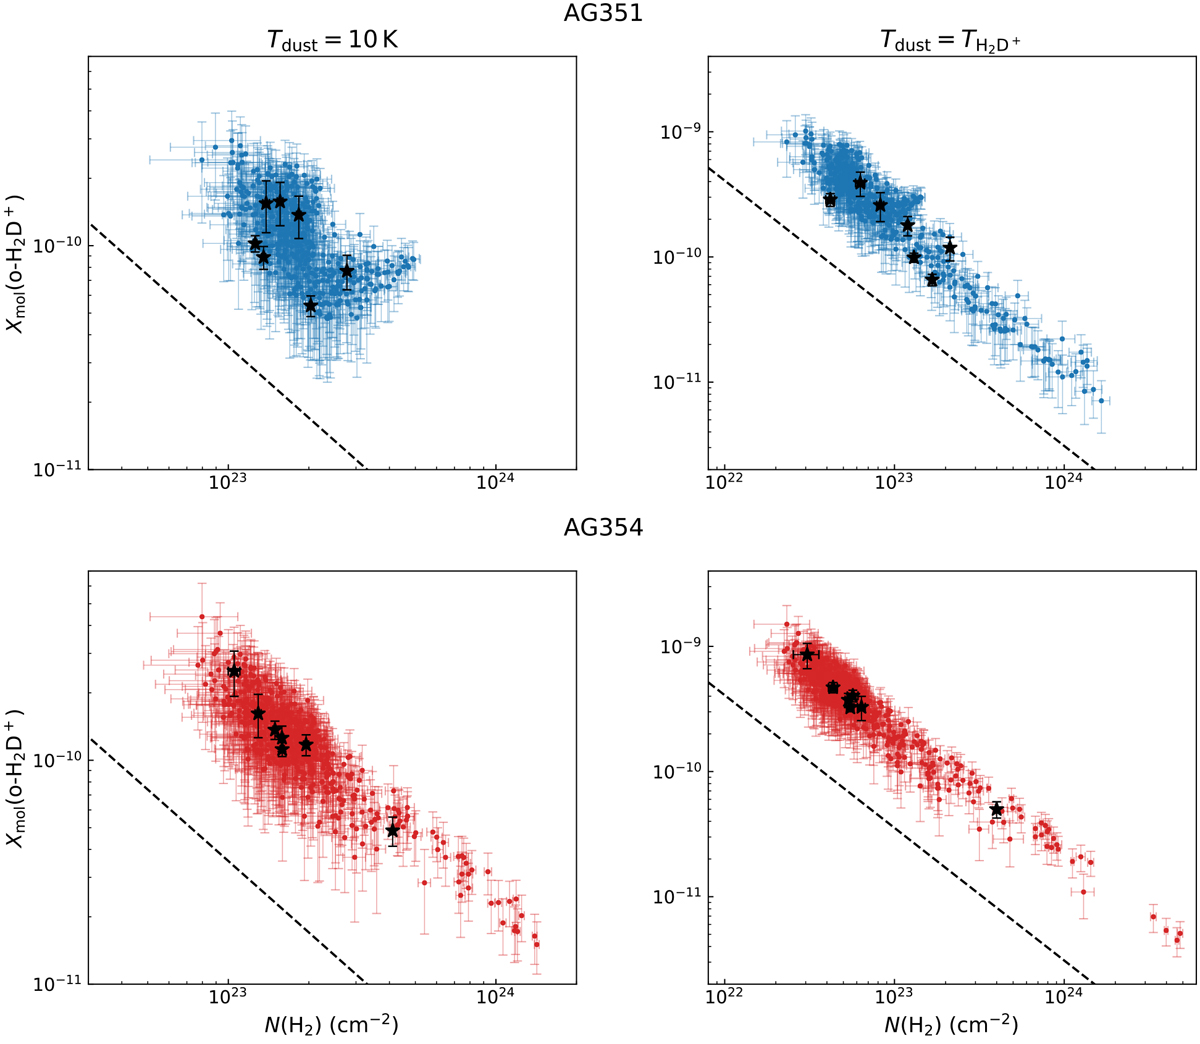
Scatterplots of o-H2D+ molecular abundance with respect to H2 column density in AG351 (blue, top panels) and AG354 (red, bottom panels). In the left panels, the quantities are computed assuming a constant temperature of 10 K. In the right panels, we use pixel-per-pixel the temperature derived from the o- H2D+(11,0−11,1) line width, in the hypothesis of only thermal contributions. Scatterplot ranges are fixed to allow an easier comparison.For the sake of readability, we only show data points for which the relative 95% confidence interval is < 50%. The dashed black curve shows the correlation found by Sabatini et al. (2020). The black stars show the average values referring to the H2D+-identified cores, for which significant continuum flux is detected. The Ncol values to compute Xmol(o-H2D+) are taken from Table 2, and the N(H2) values are computed as averages in each core.
Current usage metrics show cumulative count of Article Views (full-text article views including HTML views, PDF and ePub downloads, according to the available data) and Abstracts Views on Vision4Press platform.
Data correspond to usage on the plateform after 2015. The current usage metrics is available 48-96 hours after online publication and is updated daily on week days.
Initial download of the metrics may take a while.