Fig. A.1.
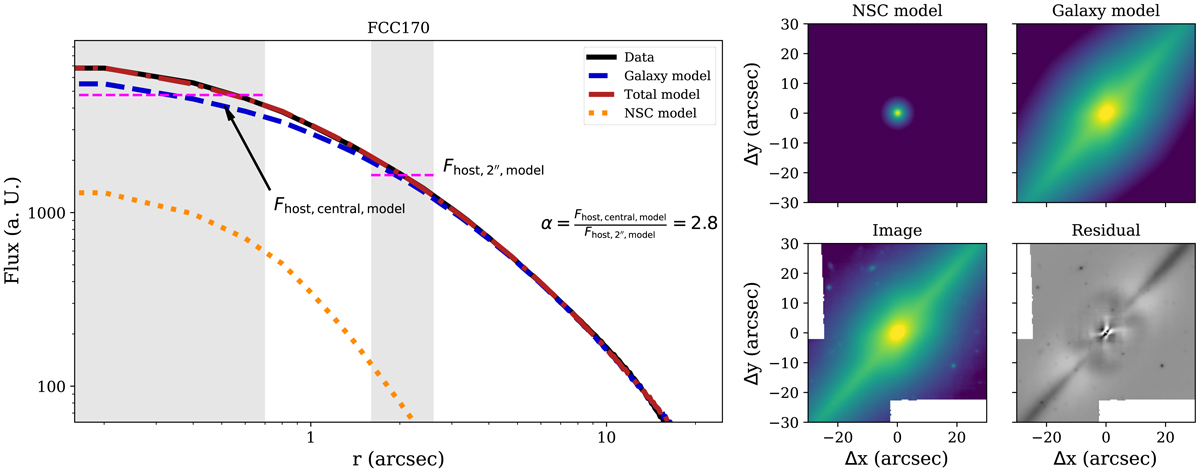
IMFIT modelling of FCC 170 to decompose the white-light image into a galaxy and a NSC component, similar to Fig. 1. Left: radial profile of the data (solid black line), galaxy model (dashed blue line), NSC model (dotted orange line), and combined model (dash-dotted red line). The grey areas show the extraction regions. The mean fluxes in these regions are indicated by the horizontal dashed magenta lines to illustrate the scaling factor α. Right: 2D cutout images of the original image (bottom left), NSC and galaxy model (top row) and resulting residual image (bottom right). In this case the galaxy model consists of a Sérsic model, an edge-on disk model, and a generalised exponential function to describe the numerous components in this galaxy. The NSC model is a Moffat function. Even with this multi-component model, there are still residuals left.
Current usage metrics show cumulative count of Article Views (full-text article views including HTML views, PDF and ePub downloads, according to the available data) and Abstracts Views on Vision4Press platform.
Data correspond to usage on the plateform after 2015. The current usage metrics is available 48-96 hours after online publication and is updated daily on week days.
Initial download of the metrics may take a while.