Fig. 5.
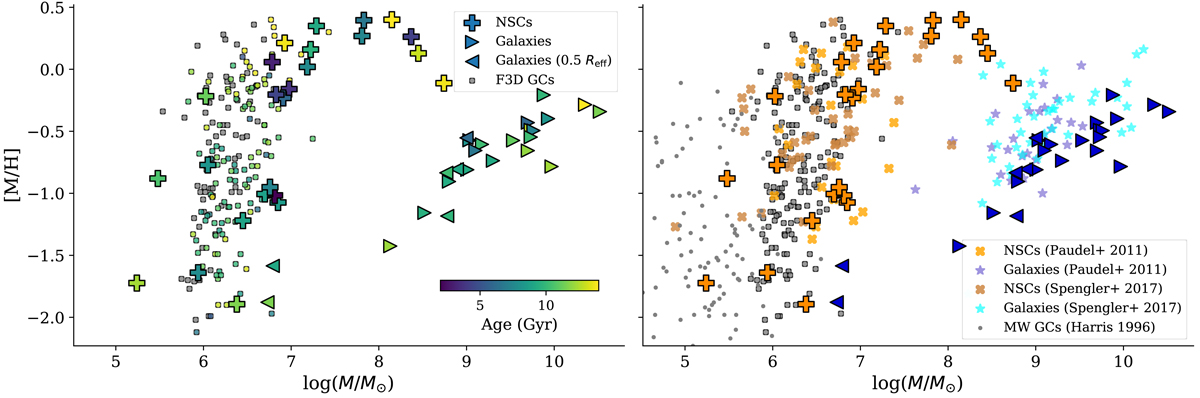
Mass–metallicity plane. Both panels show mass and metallicity for the host galaxies of our sample at 1.0 Reff where available (rightward triangles, otherwise leftward triangles), NSCs (plus symbols) and GCs (coloured circles, from Fahrion et al. 2020b). Left: components are colour-coded by mean age, inferred from full spectrum fitting. Right: shown for comparison are the literature NSCs (orange and brown crosses) and their hosts galaxies (light blue and purple stars) from Paudel et al. (2011) and Spengler et al. (2017), and MW GCs (small grey dots) from Harris (1996).
Current usage metrics show cumulative count of Article Views (full-text article views including HTML views, PDF and ePub downloads, according to the available data) and Abstracts Views on Vision4Press platform.
Data correspond to usage on the plateform after 2015. The current usage metrics is available 48-96 hours after online publication and is updated daily on week days.
Initial download of the metrics may take a while.