Fig. 3.
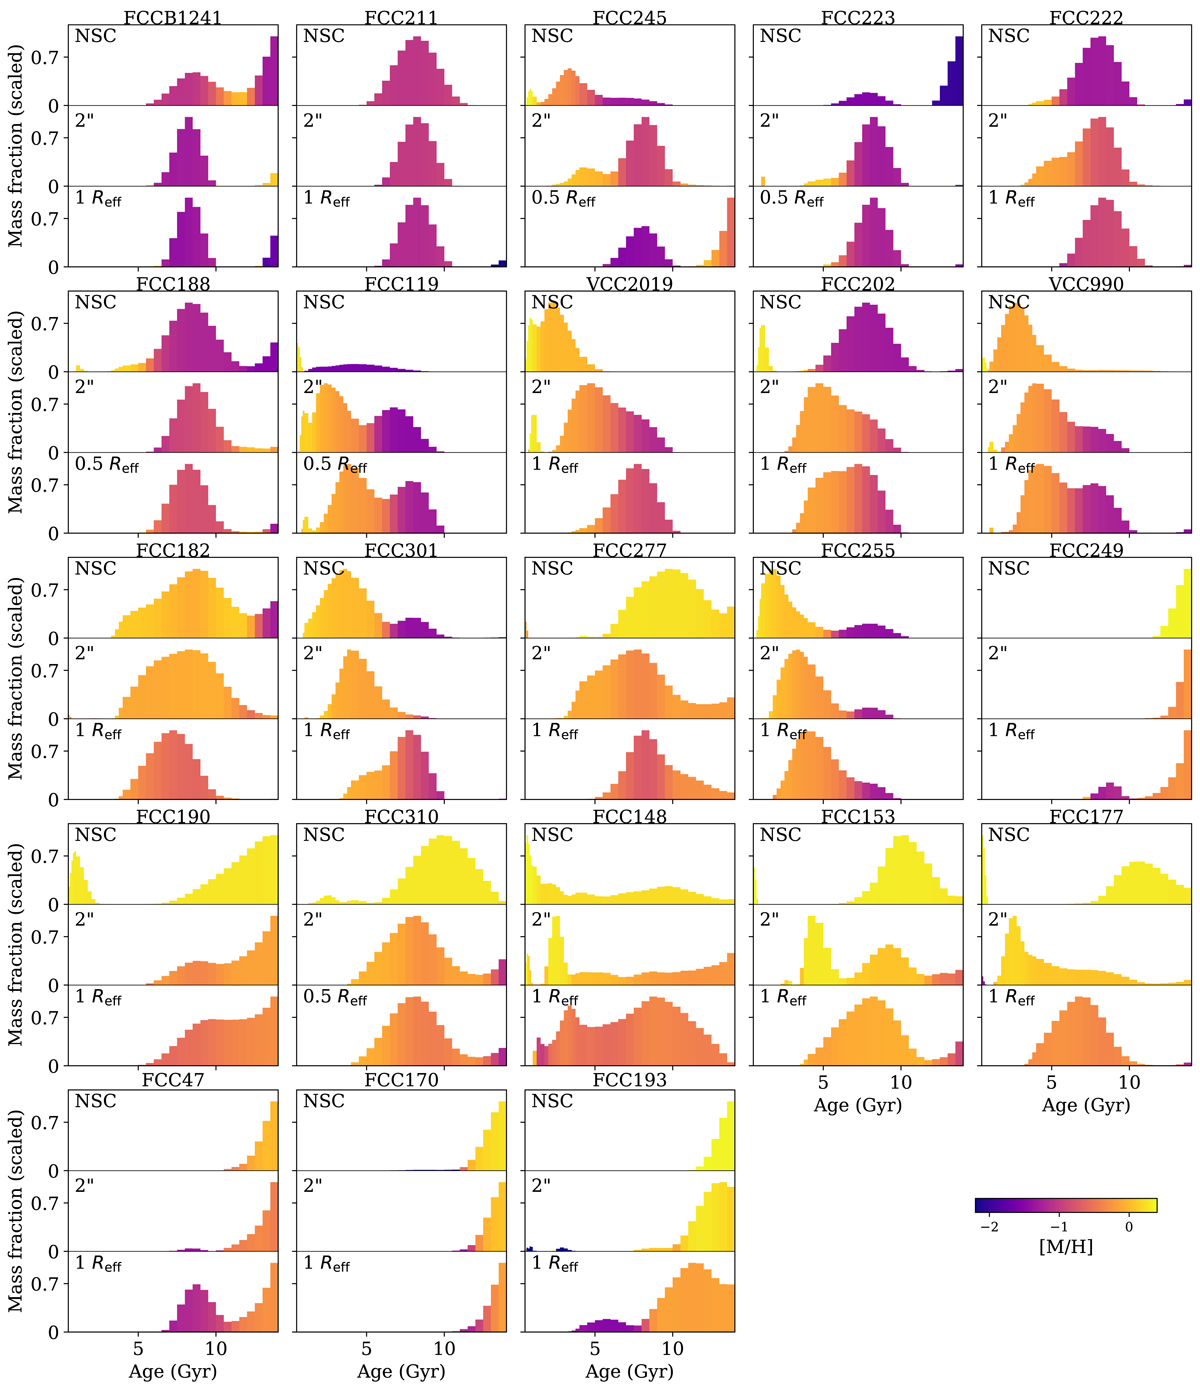
Star formation histories of NSCs (top), at the 2″ extraction annulus (middle), and host galaxy (bottom); each panel corresponds to one galaxy. The mass fractions are scaled such that the peak is at 1.0 for visualisation of their shape. The galaxies are ordered by increasing stellar mass and the bins are colour-coded by their mean metallicity.
Current usage metrics show cumulative count of Article Views (full-text article views including HTML views, PDF and ePub downloads, according to the available data) and Abstracts Views on Vision4Press platform.
Data correspond to usage on the plateform after 2015. The current usage metrics is available 48-96 hours after online publication and is updated daily on week days.
Initial download of the metrics may take a while.