Fig. 2.
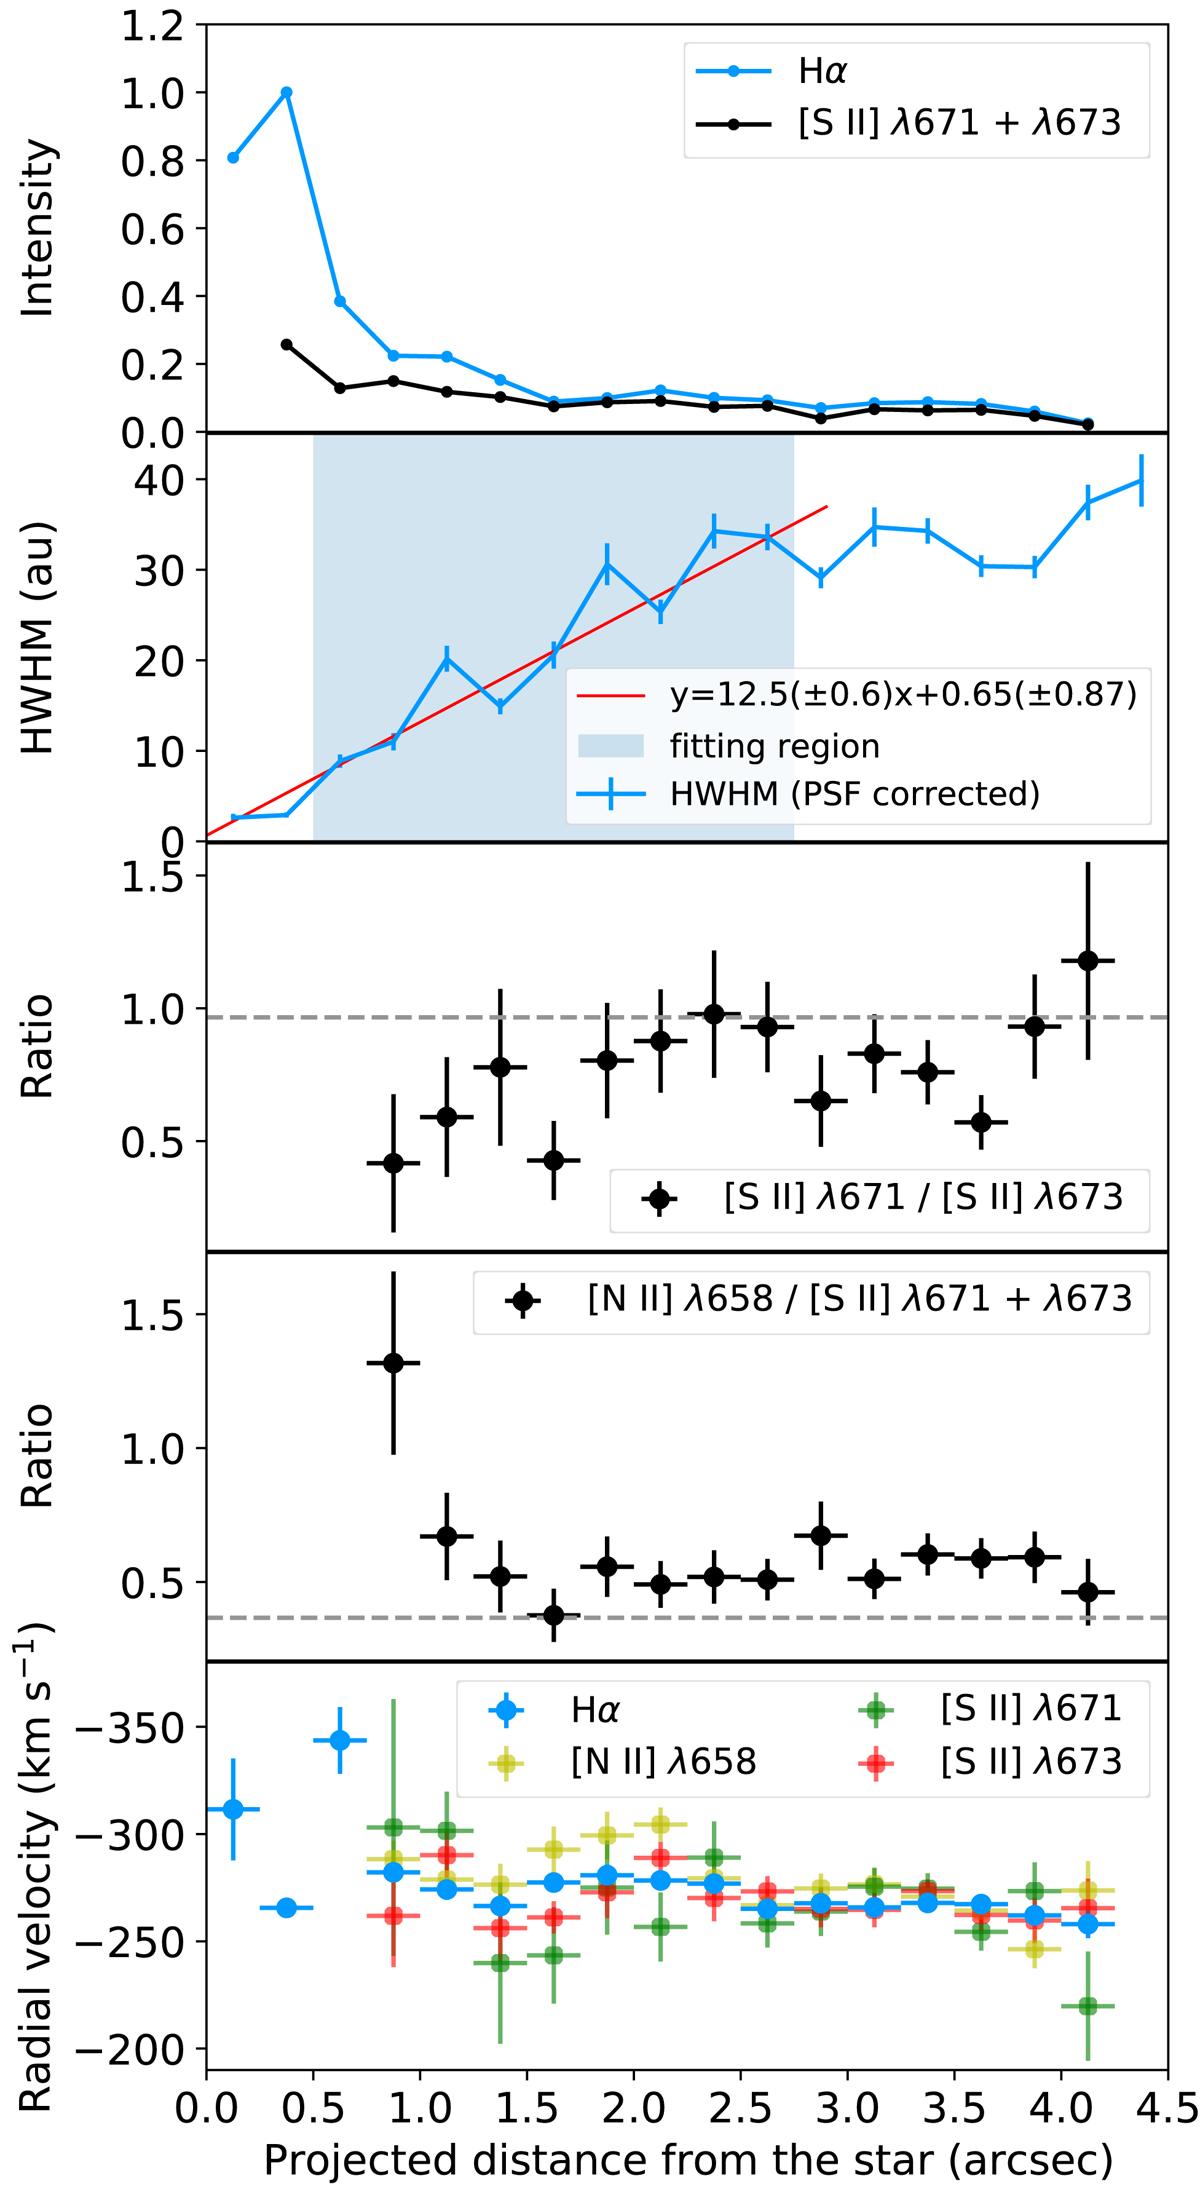
Variation in the line properties along the blue-shifted jet lobe. From top to bottom panel: intensity profiles of the lines, PSF corrected jet half width half maximum (HWHM) at Hα, observed ratios [S II] λ671/[S II] λ671 and [N II] λ658/[S II] (λ671+λ673), and radial velocities of lines. The red line shows the fitting result of the data in the fitting region, which gives a jet radius of 0.65 ± 0.87 au at the star, before correcting for the inclination effect. The gray dashed lines represent the minimum [S II] ratio and the maximum [N II]/[S II] ratio observed at the outer region in Ellerbroek et al. (2014), respectively.
Current usage metrics show cumulative count of Article Views (full-text article views including HTML views, PDF and ePub downloads, according to the available data) and Abstracts Views on Vision4Press platform.
Data correspond to usage on the plateform after 2015. The current usage metrics is available 48-96 hours after online publication and is updated daily on week days.
Initial download of the metrics may take a while.