Fig. 1.
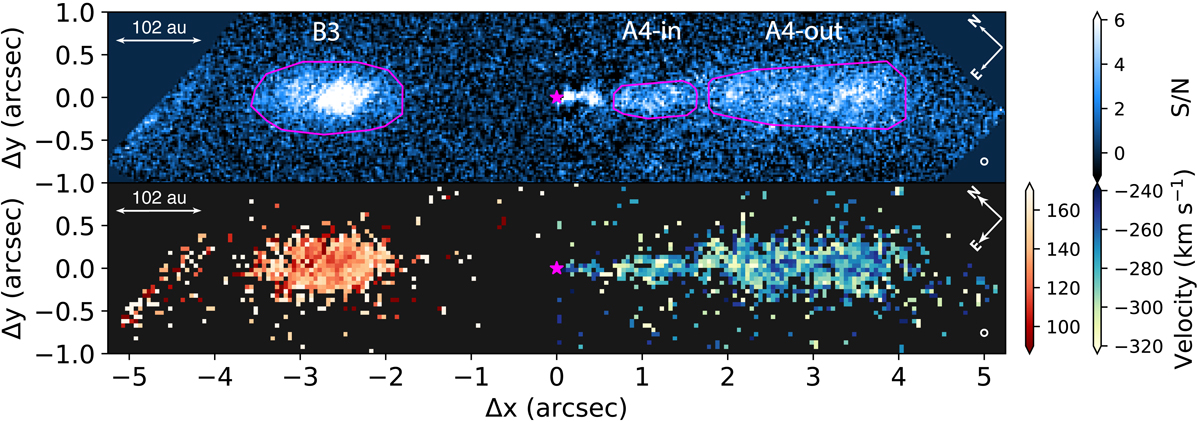
S/N (top) and radial velocity (bottom) maps of the asymmetric jet in HD 163296 detected by MUSE, traced by [S II] λ673 (Δx < 0) and Hα lines (Δx > 0), respectively. The red-shifted lobe is at Δx < 0 and the blue-shifted lobe is at Δx > 0. The magenta polygon indicates the region where we measured the integrated jet flux. The spatial resolutions of the S/N and velocity maps are indicated by the white circles of ∼75 mas in diameter in the bottom right of each panel, which are ∼3 and ∼1.5 (2 × 2 binning) spaxels across, respectively. Only spaxels that have the S/N of the line emission larger than 3σ were used to construct the velocity map. The velocity uncertainty map is shown in Fig. D.1. At the target distance of 101.5 pc, 1″ corresponds to a scale of 102 au. The magenta star marks the star center.
Current usage metrics show cumulative count of Article Views (full-text article views including HTML views, PDF and ePub downloads, according to the available data) and Abstracts Views on Vision4Press platform.
Data correspond to usage on the plateform after 2015. The current usage metrics is available 48-96 hours after online publication and is updated daily on week days.
Initial download of the metrics may take a while.