Fig. 1.
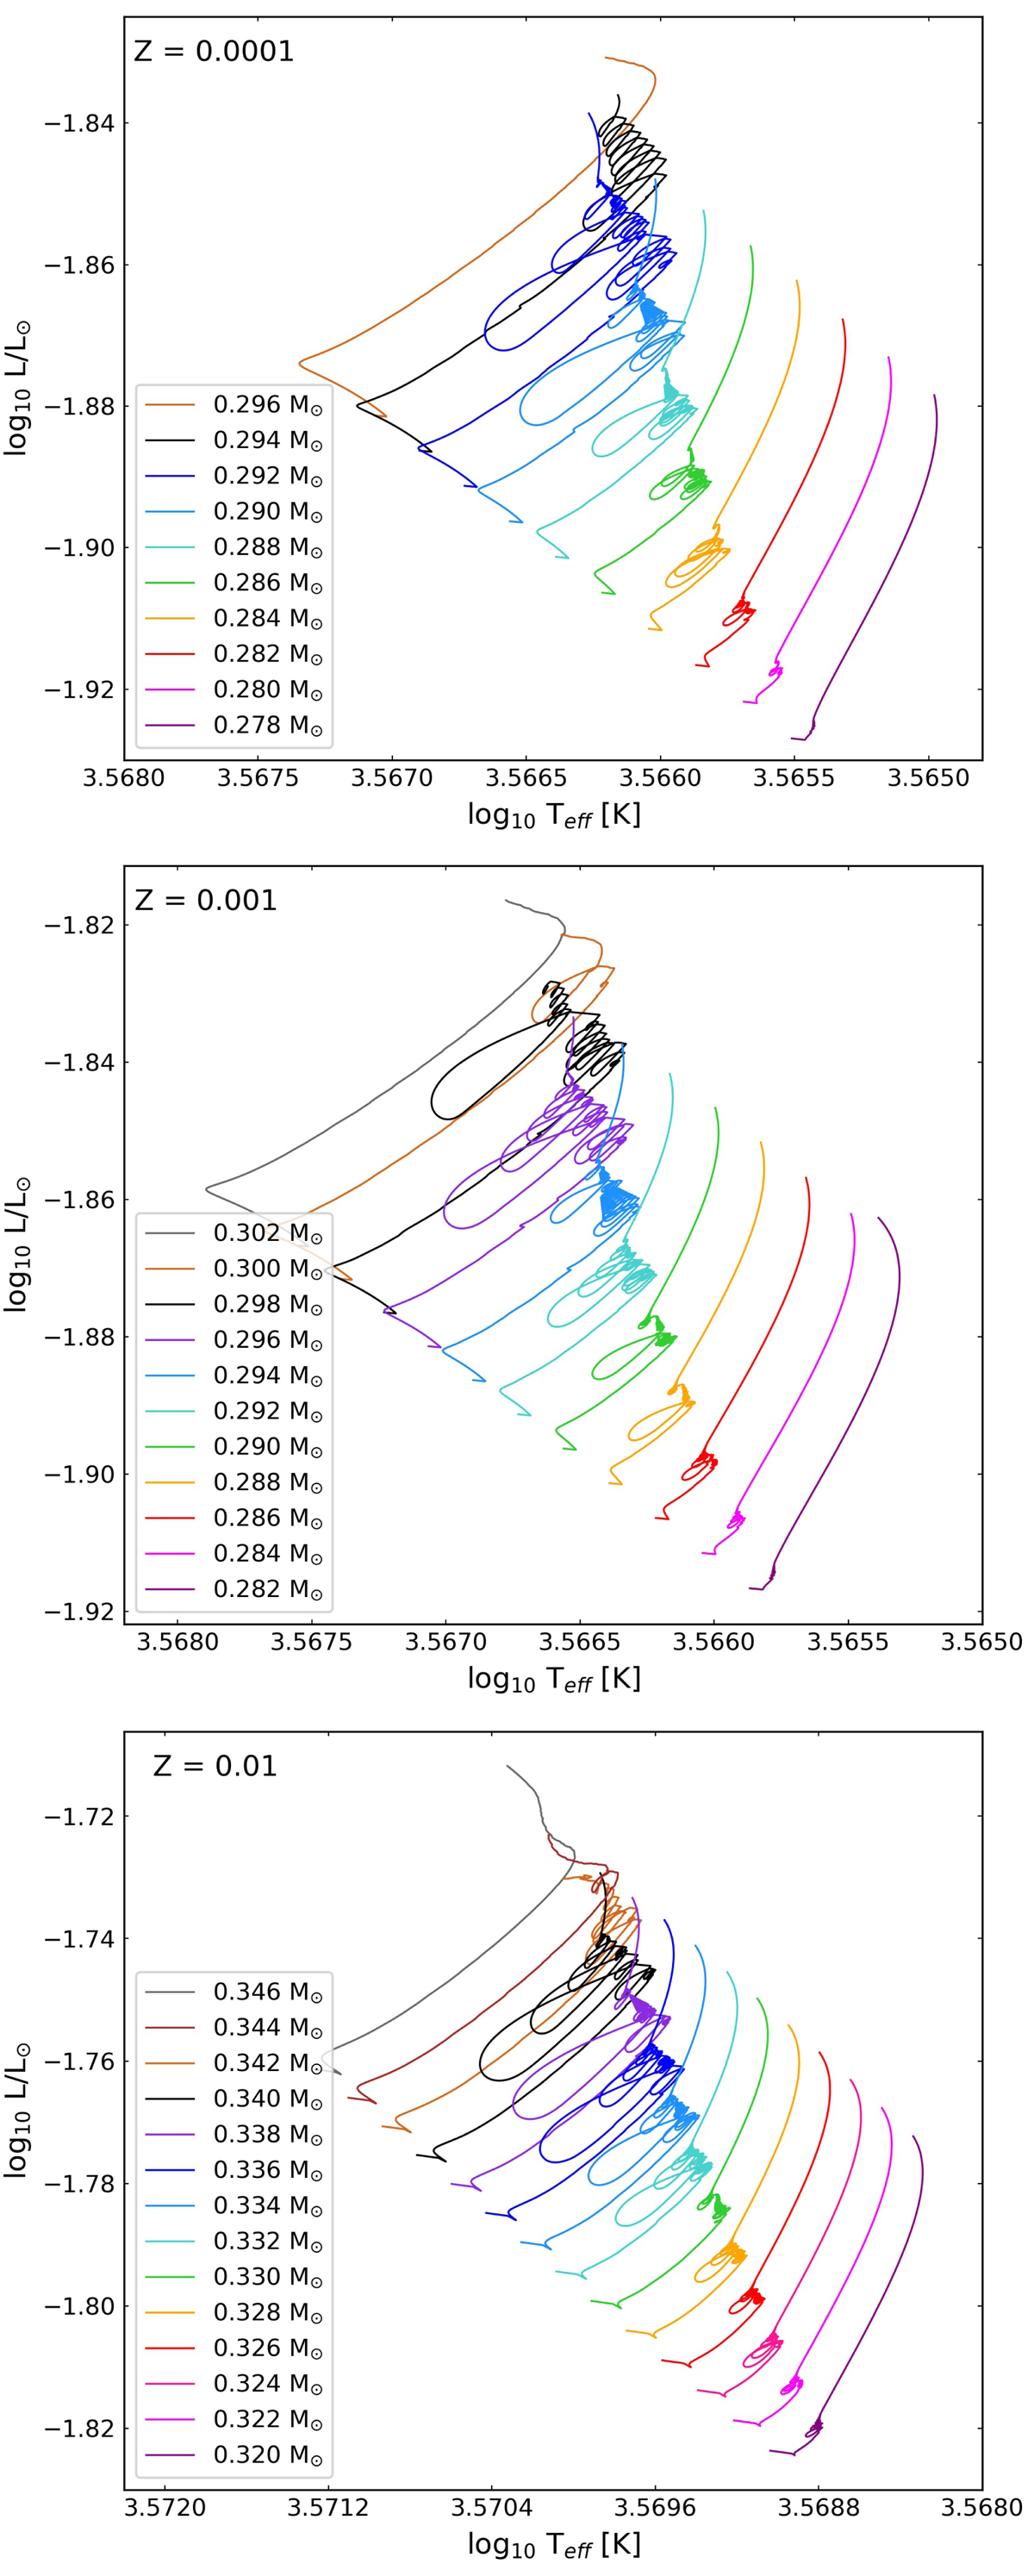
Evolutionary tracks shown in the HR diagram for three sets of stellar models with metallicities Z = 0.0001 (top), Z = 0.001 (middle), and Z = 0.01 (bottom). The models begin their evolution on the left and move upwards along the tracks to reach the final points at 10 Gyr. The stars are on the MS throughout this evolution.
Current usage metrics show cumulative count of Article Views (full-text article views including HTML views, PDF and ePub downloads, according to the available data) and Abstracts Views on Vision4Press platform.
Data correspond to usage on the plateform after 2015. The current usage metrics is available 48-96 hours after online publication and is updated daily on week days.
Initial download of the metrics may take a while.