Fig. 2.
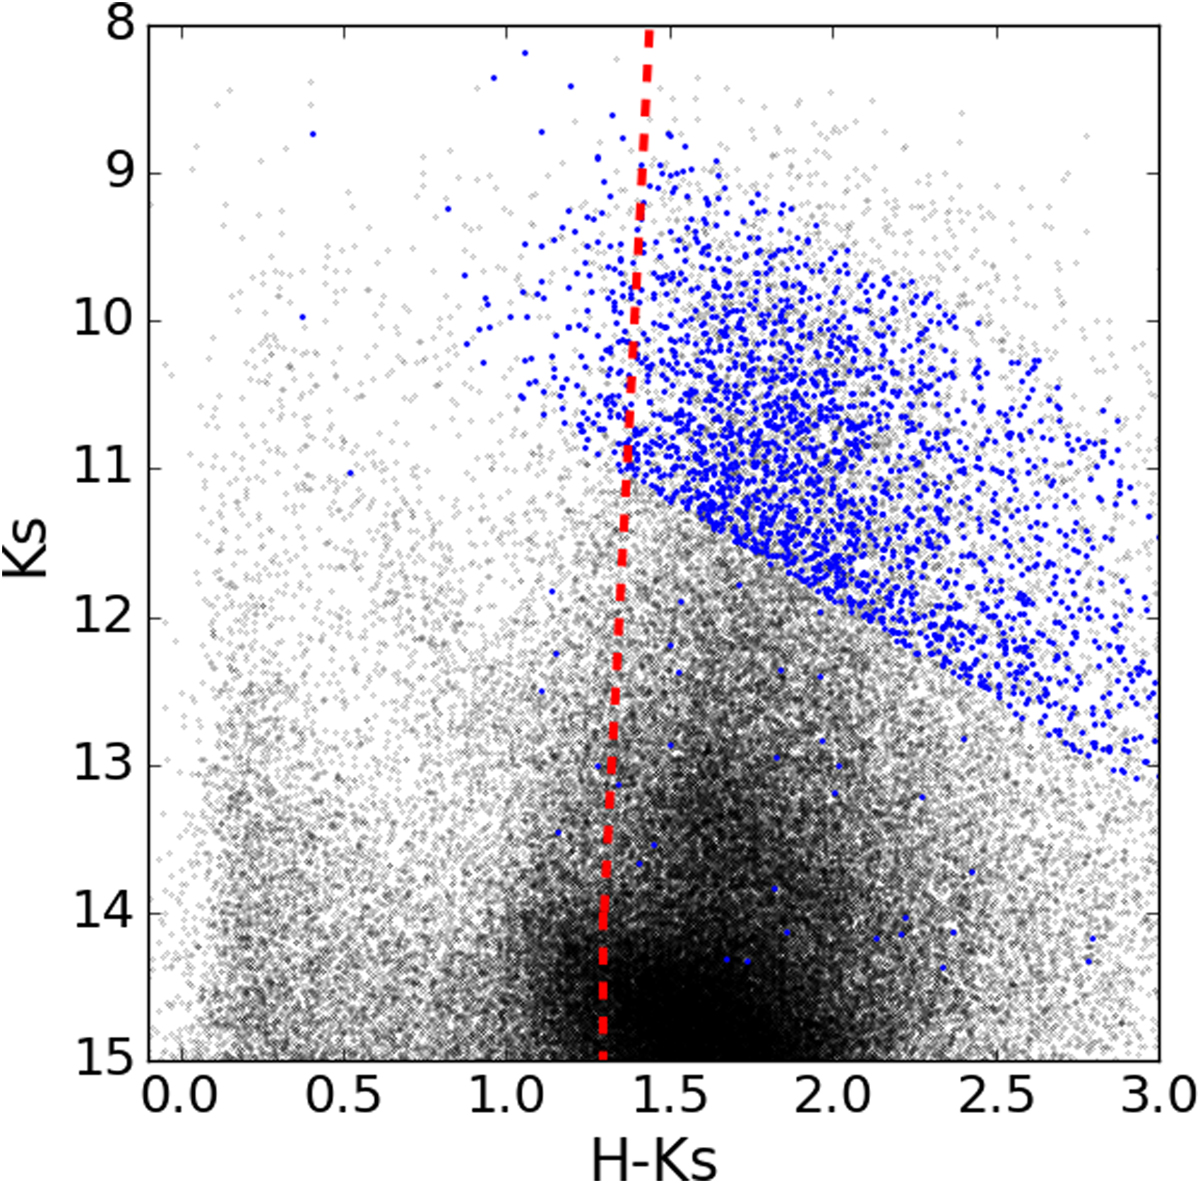
CMD Ks vs. H − Ks for the regions corresponding to the NSD. The blue points correspond to the stars in the KMOS survey. The black dots indicate stars within the same regions from the SIRIUS/IRSF GC survey (e.g. Nagayama et al. 2003; Nishiyama et al. 2006). The red dashed line shows the colour cut used to remove foreground stars from the Galactic disc and the innermost bulge following previous work (e.g. Nogueras-Lara et al. 2018a, 2019; Sormani et al. 2020).
Current usage metrics show cumulative count of Article Views (full-text article views including HTML views, PDF and ePub downloads, according to the available data) and Abstracts Views on Vision4Press platform.
Data correspond to usage on the plateform after 2015. The current usage metrics is available 48-96 hours after online publication and is updated daily on week days.
Initial download of the metrics may take a while.