Open Access
Fig. 14.
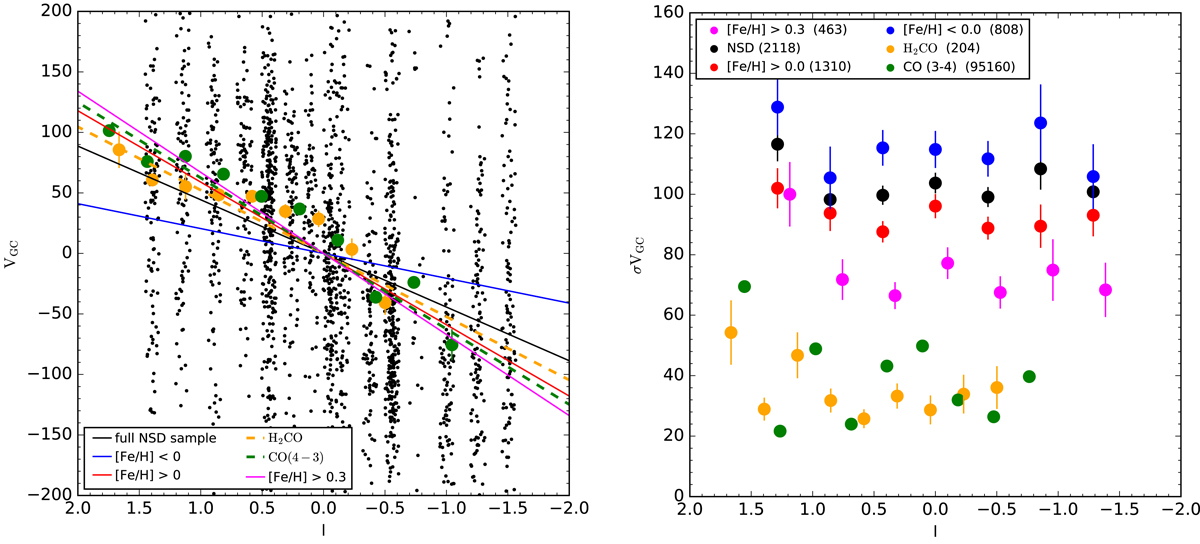
Left panel: similar as in Fig. 8. The magenta line indicates the fitted relation for [Fe/H] > 0.3. The orange points show the H2CO data of Ginsburg et al. (2016) and the orange dotted line shows the best linear fit. Right panel: velocity dispersion as a function of Galactic longitude (same symbols).
Current usage metrics show cumulative count of Article Views (full-text article views including HTML views, PDF and ePub downloads, according to the available data) and Abstracts Views on Vision4Press platform.
Data correspond to usage on the plateform after 2015. The current usage metrics is available 48-96 hours after online publication and is updated daily on week days.
Initial download of the metrics may take a while.