Fig. 10.
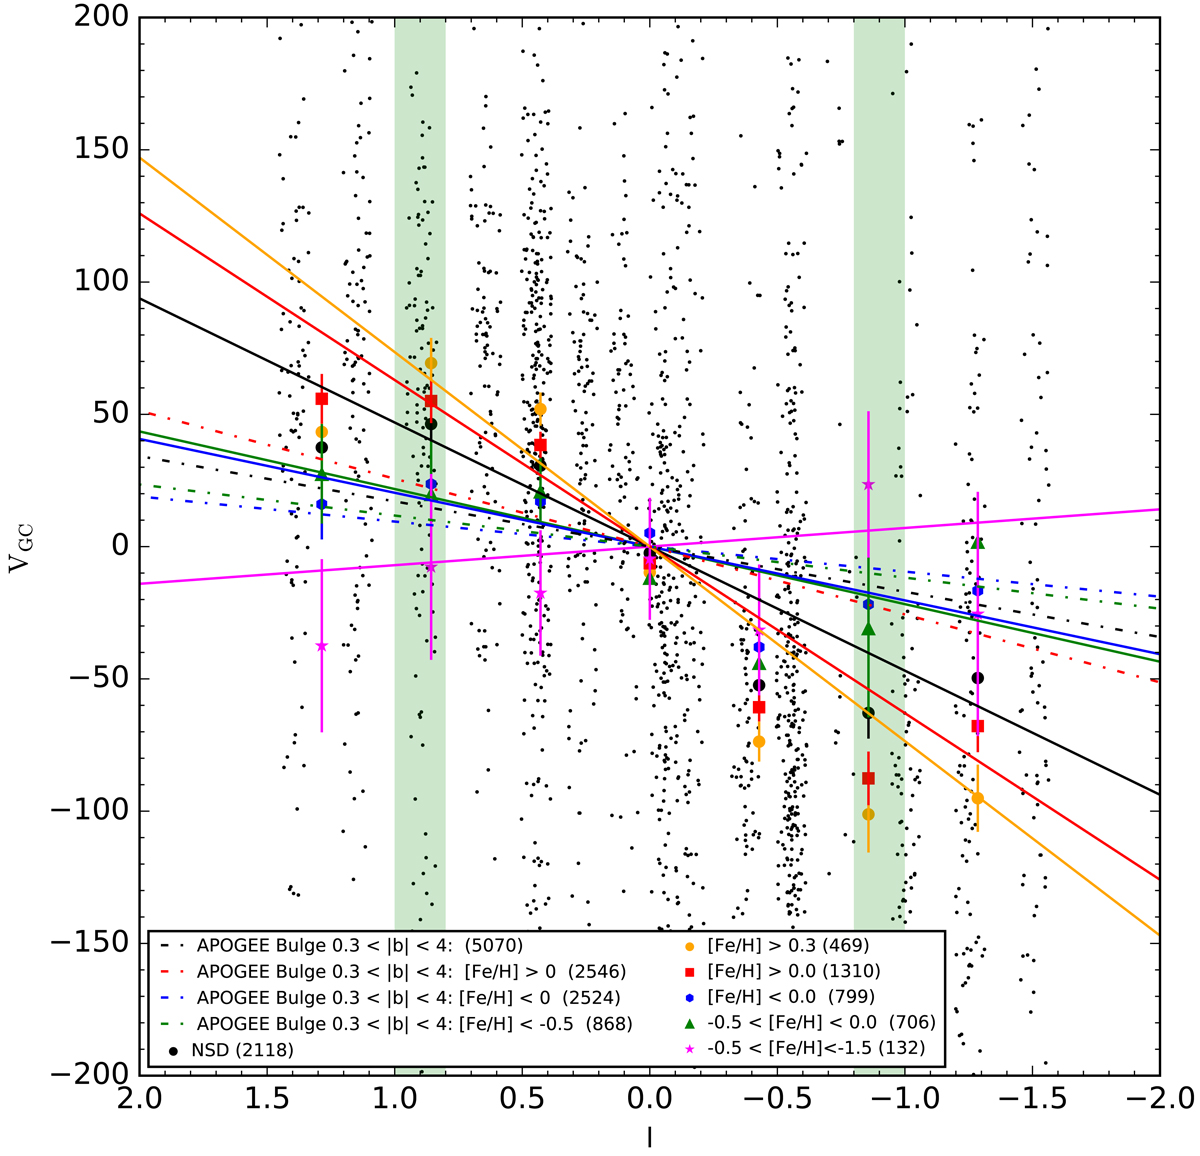
Galactocentric velocity vs. Galactic longitude. The points represent the mean values of VGC for samples binned in Galactic longitude. The respective error bars stand for the standard error of the mean computed as ![]() , where N is the number of points in the respective bin. The black line shows a linear fit of the full NSD sample, the orange line for stars with [Fe/H] > 0.3, the red line for MR stars with [Fe/H] > 0, the blue line for stars with [Fe/H] < 0, the green line for stars with −0.5 < [Fe/H] < 0, and the magenta line for stars with [Fe/H] < −0.5. The dash-dotted lines show the corresponding APOGEE bulge sample (see text). The two green areas indicate the approximate radius of the NSD.
, where N is the number of points in the respective bin. The black line shows a linear fit of the full NSD sample, the orange line for stars with [Fe/H] > 0.3, the red line for MR stars with [Fe/H] > 0, the blue line for stars with [Fe/H] < 0, the green line for stars with −0.5 < [Fe/H] < 0, and the magenta line for stars with [Fe/H] < −0.5. The dash-dotted lines show the corresponding APOGEE bulge sample (see text). The two green areas indicate the approximate radius of the NSD.
Current usage metrics show cumulative count of Article Views (full-text article views including HTML views, PDF and ePub downloads, according to the available data) and Abstracts Views on Vision4Press platform.
Data correspond to usage on the plateform after 2015. The current usage metrics is available 48-96 hours after online publication and is updated daily on week days.
Initial download of the metrics may take a while.