Fig. 1.
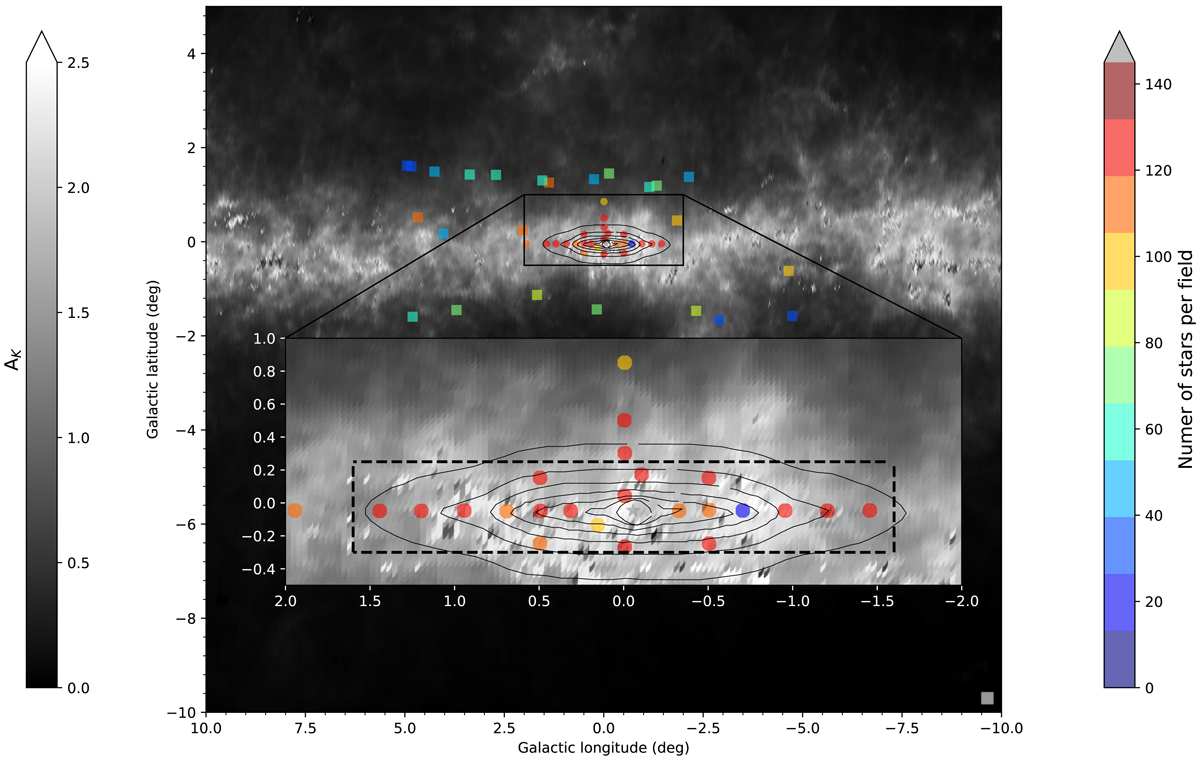
Location of the different KMOS fields of our sample (filled circles) superimposed on the extinction map of Gonzalez et al. (2012). The filled squares indicate the APOGEE DR16 comparison sample. The colour scale represents the number of objects, while the grey scale the AKs value of the extinction map. The black contours show the surface brightness map of the best-fit model of the nuclear bulge component by Launhardt et al. (2002).
Current usage metrics show cumulative count of Article Views (full-text article views including HTML views, PDF and ePub downloads, according to the available data) and Abstracts Views on Vision4Press platform.
Data correspond to usage on the plateform after 2015. The current usage metrics is available 48-96 hours after online publication and is updated daily on week days.
Initial download of the metrics may take a while.