Free Access
Fig. 4.
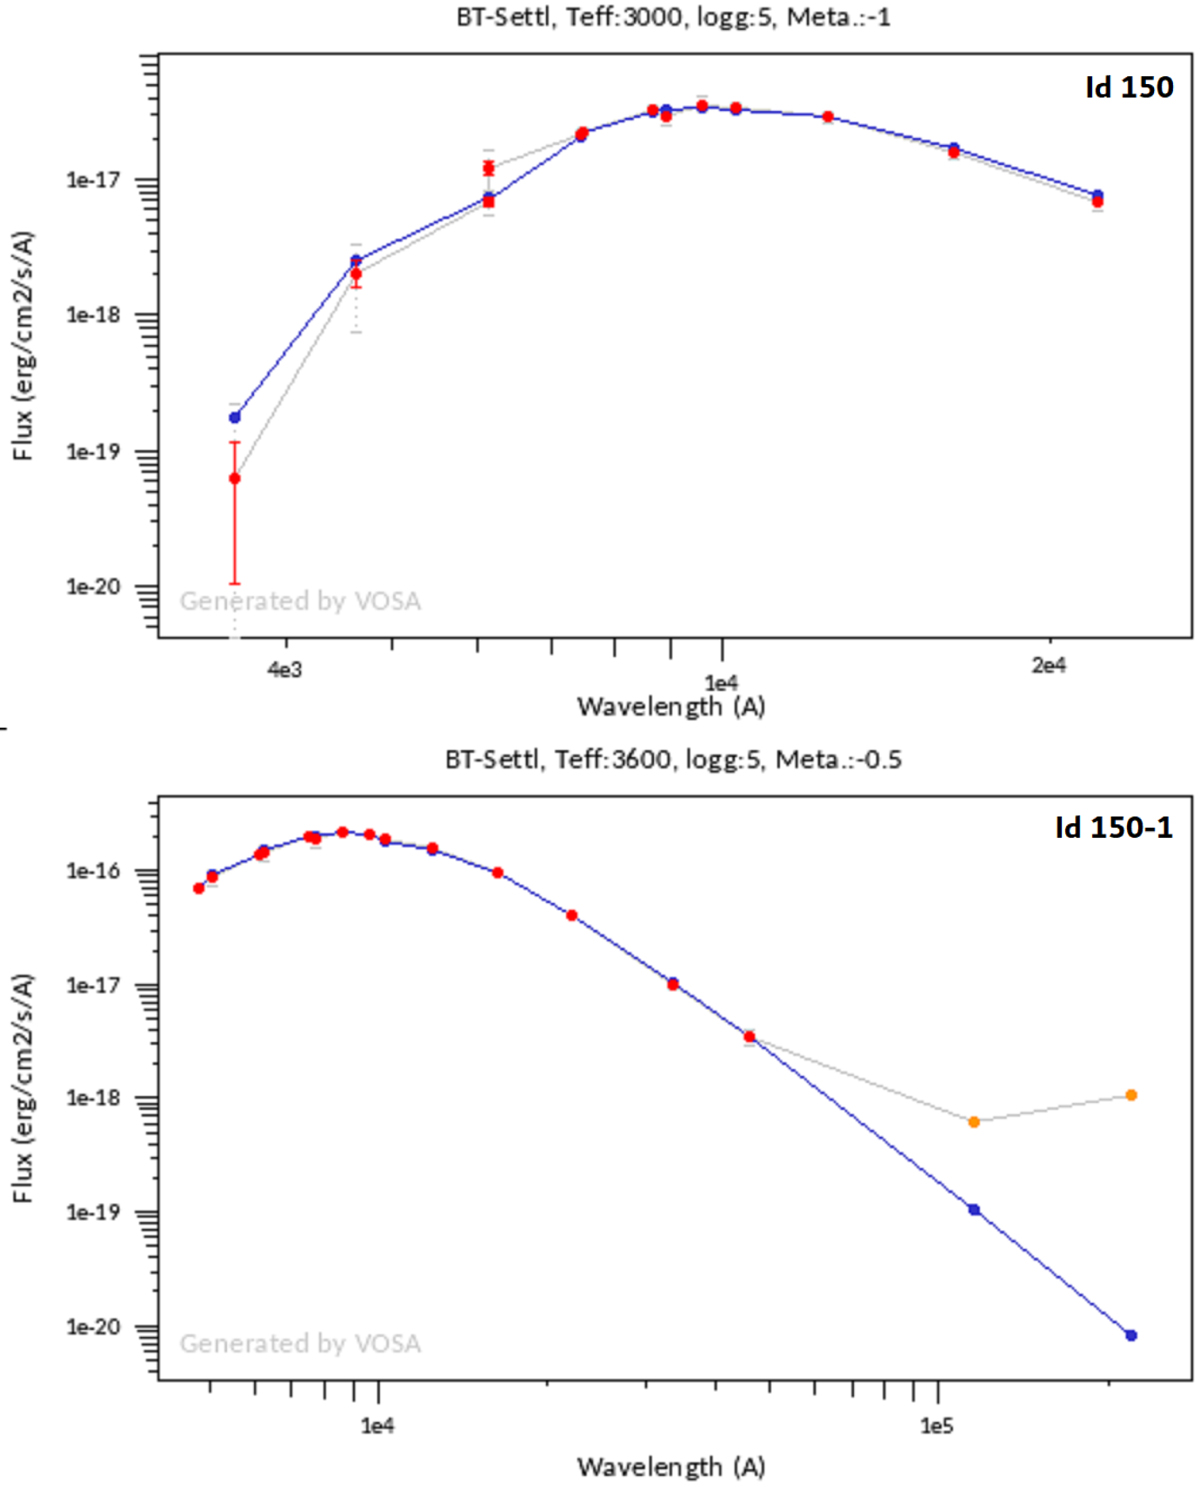
VOSA diagrams for the source Id 150 (top) and its candidate companion (bottom). The shown elements are: Observed flux + 3-sigma points (pale grey line + error bars), fitted flux (red dots + error bars), no fitted points (orange dots + error bars), and BT-Settl model (blue line).
Current usage metrics show cumulative count of Article Views (full-text article views including HTML views, PDF and ePub downloads, according to the available data) and Abstracts Views on Vision4Press platform.
Data correspond to usage on the plateform after 2015. The current usage metrics is available 48-96 hours after online publication and is updated daily on week days.
Initial download of the metrics may take a while.