Fig. A.9.
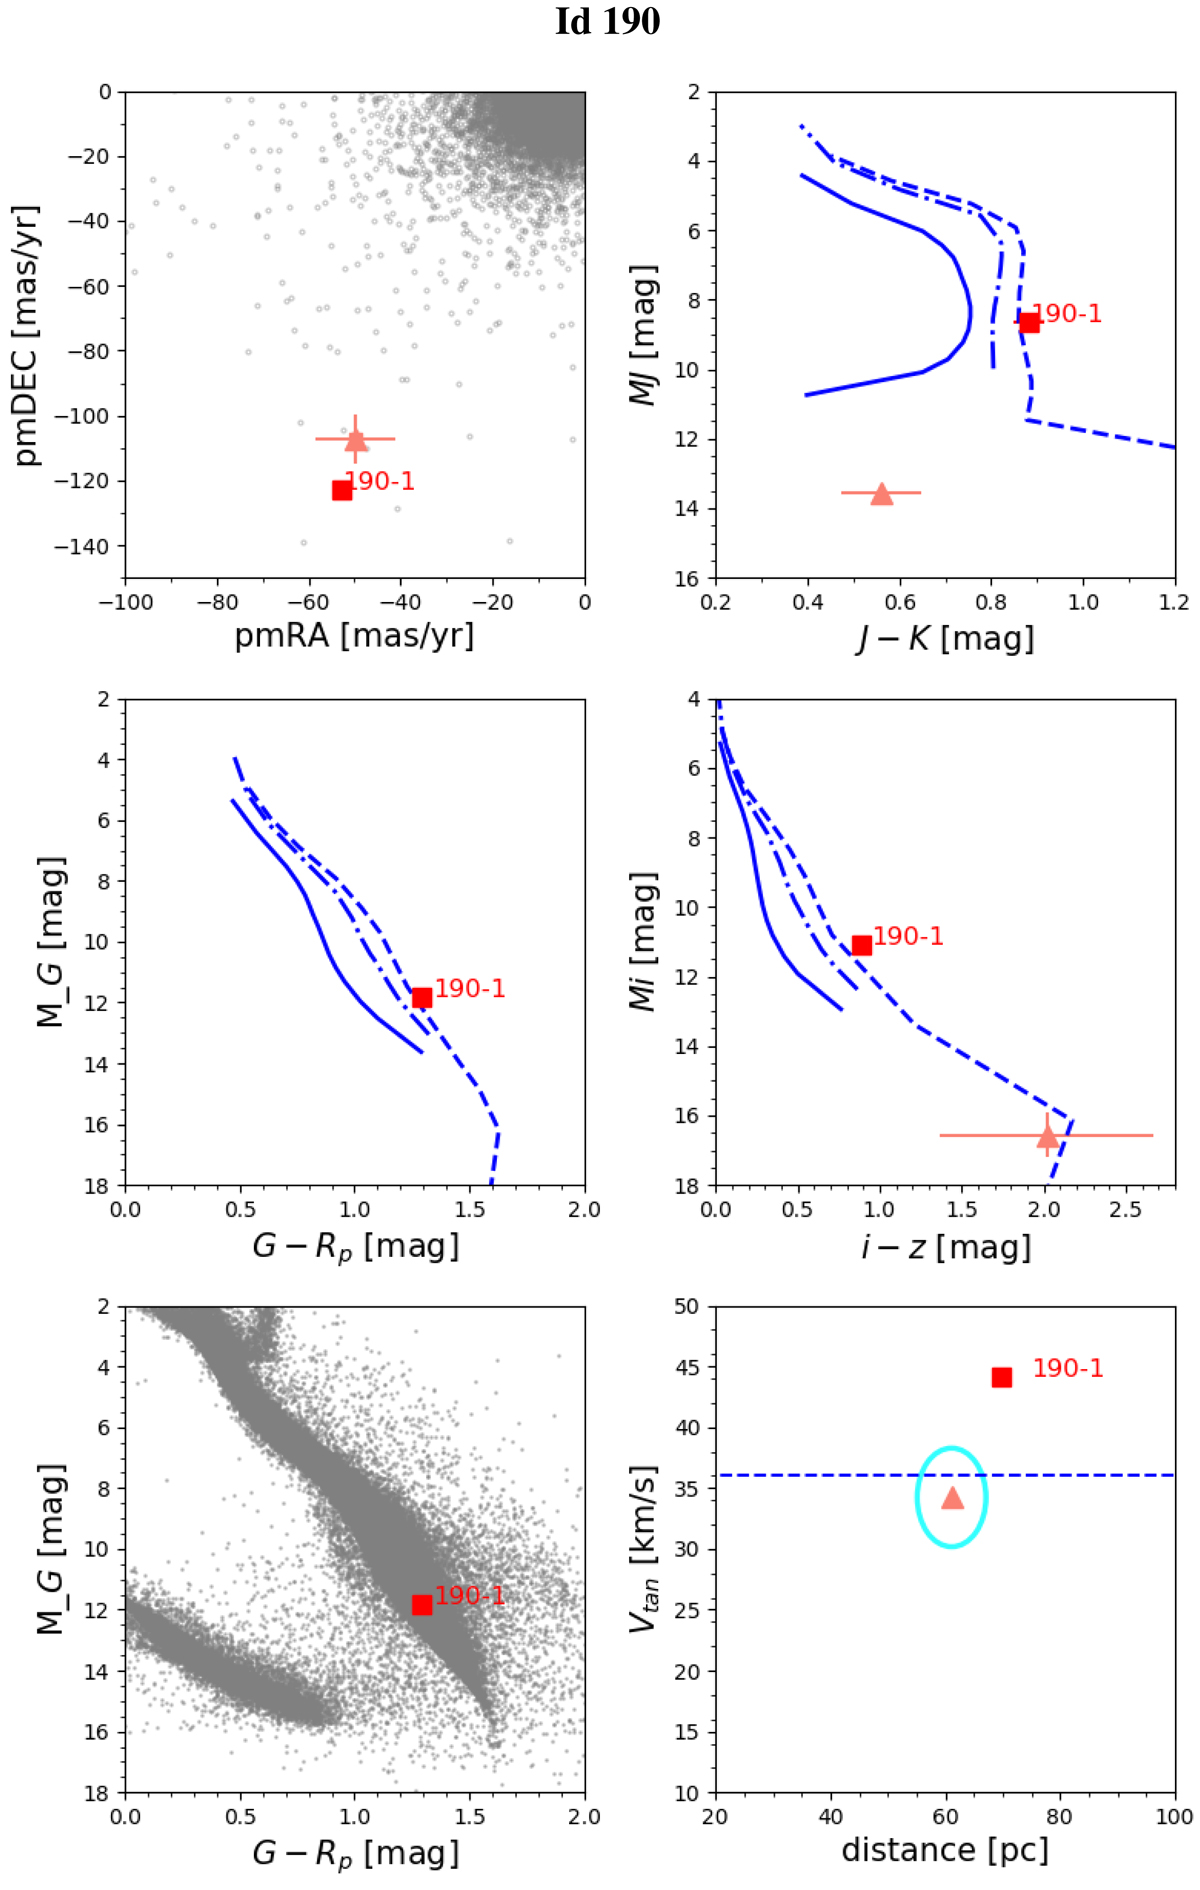
PMD (top left panel), CMDs (top right and mid panels), HRD (bottom left panel), and tangential velocity–distance diagram (bottom right) for the target Id 190 and its candidate companion. The filled pink triangle represents the source under study, and the numbered red square represents the companion candidate. Grey dots in the PMD represent field stars, and in the HRD they are Gaia DR2 sources with parallaxes larger than 10 mas used as a reference. The blue solid, dashed and dotted lines stand for [M/H] = −2.0, [M/H] = −0.5 and [M/H] = 0.0 BT-Settl isochrones in the CMDs. The blue dotted line in the tangential velocity plot marks the value Vtan = 36 km s−1 which is the mean value for field stars (Zhang et al. 2018b), and the light blue ellipse around Id 190 indicates its values of Vtan ± σ and d ± σ.
Current usage metrics show cumulative count of Article Views (full-text article views including HTML views, PDF and ePub downloads, according to the available data) and Abstracts Views on Vision4Press platform.
Data correspond to usage on the plateform after 2015. The current usage metrics is available 48-96 hours after online publication and is updated daily on week days.
Initial download of the metrics may take a while.