Fig. 8
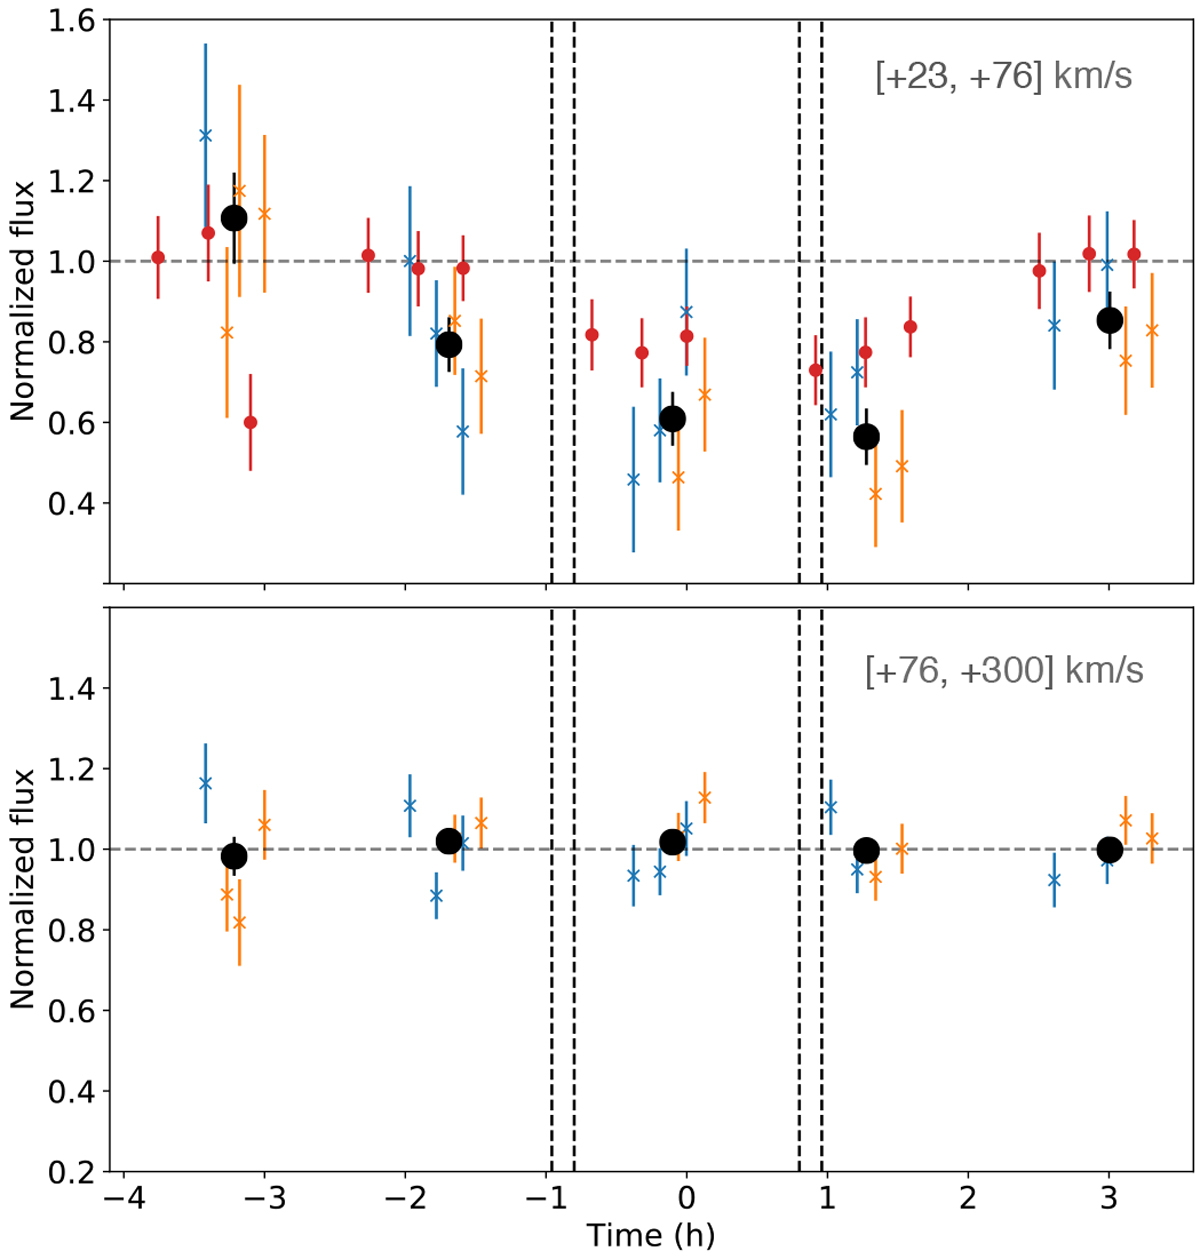
Light curves of GJ 3470 in the red wing of the Lyman-α line. Top and bottom panels: flux integrated, respectively, over [+23, +76] and [+76, +300] km s−1 in the stellar rest frame. Blue and orange points correspond to COS exposures in Visits D and E, binned over the phase window of each HST orbit into the black points. Red points correspond to STIS exposures in Visits A, B, and C (Bourrier et al. 2018a). All data were normalized by the fluxes in the first and last HST orbits. Vertical dashed lines indicate the transit contacts.
Current usage metrics show cumulative count of Article Views (full-text article views including HTML views, PDF and ePub downloads, according to the available data) and Abstracts Views on Vision4Press platform.
Data correspond to usage on the plateform after 2015. The current usage metrics is available 48-96 hours after online publication and is updated daily on week days.
Initial download of the metrics may take a while.