Fig. 7
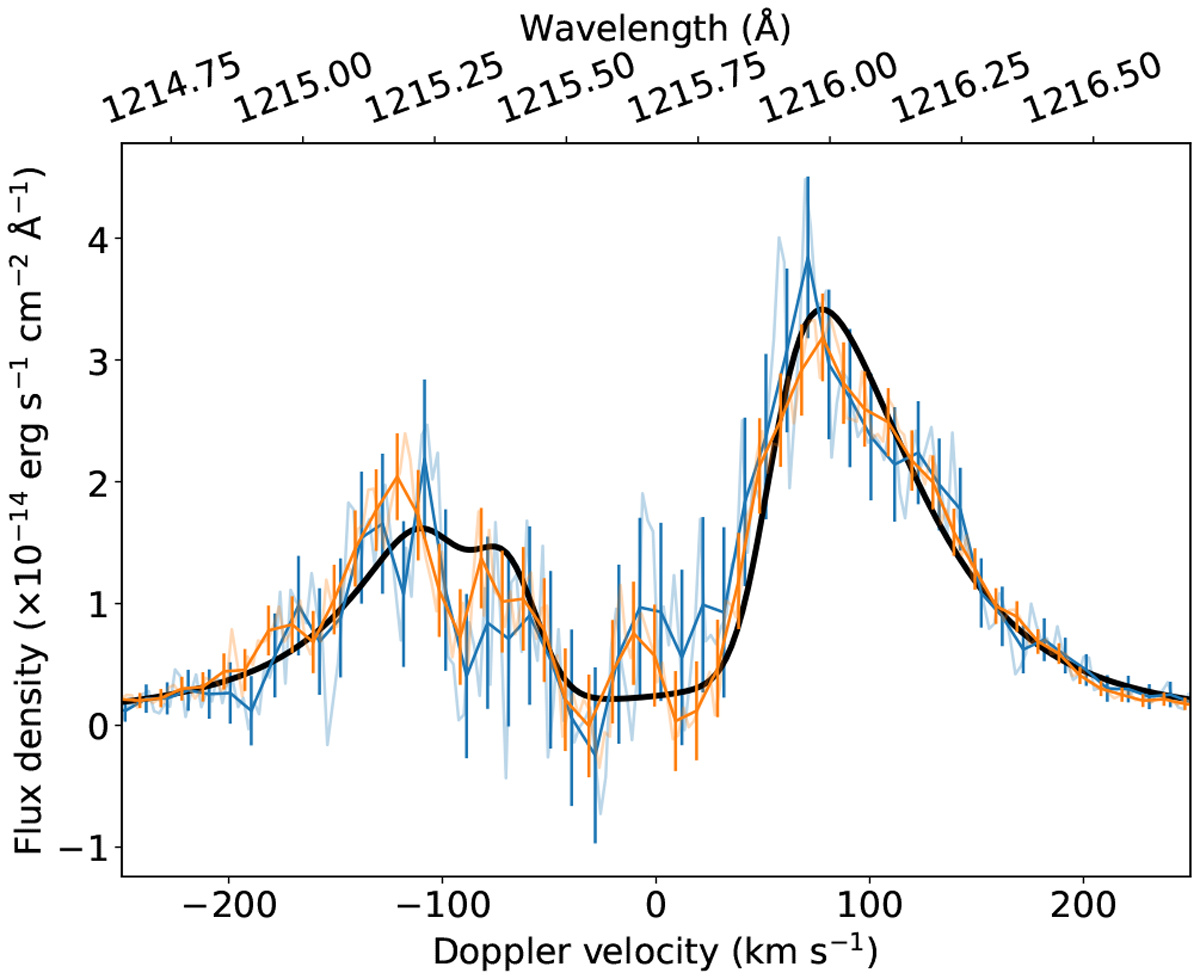
Lyman-α line of GJ 3470, plotted in the stellar rest frame. The blue and orange profiles show the COS spectra corrected for airglow contamination and averaged, respectively, over the out-of-transit and in-transit HST orbits in Visits D and E. Light profiles are the spectra at the original COS resolution, while strong profiles are binned with a 10 km s−1 resolution. The black profile is the best-fit model to the observed STIS Lyman-α line from Bourrier et al. (2018a).
Current usage metrics show cumulative count of Article Views (full-text article views including HTML views, PDF and ePub downloads, according to the available data) and Abstracts Views on Vision4Press platform.
Data correspond to usage on the plateform after 2015. The current usage metrics is available 48-96 hours after online publication and is updated daily on week days.
Initial download of the metrics may take a while.