Fig. 6
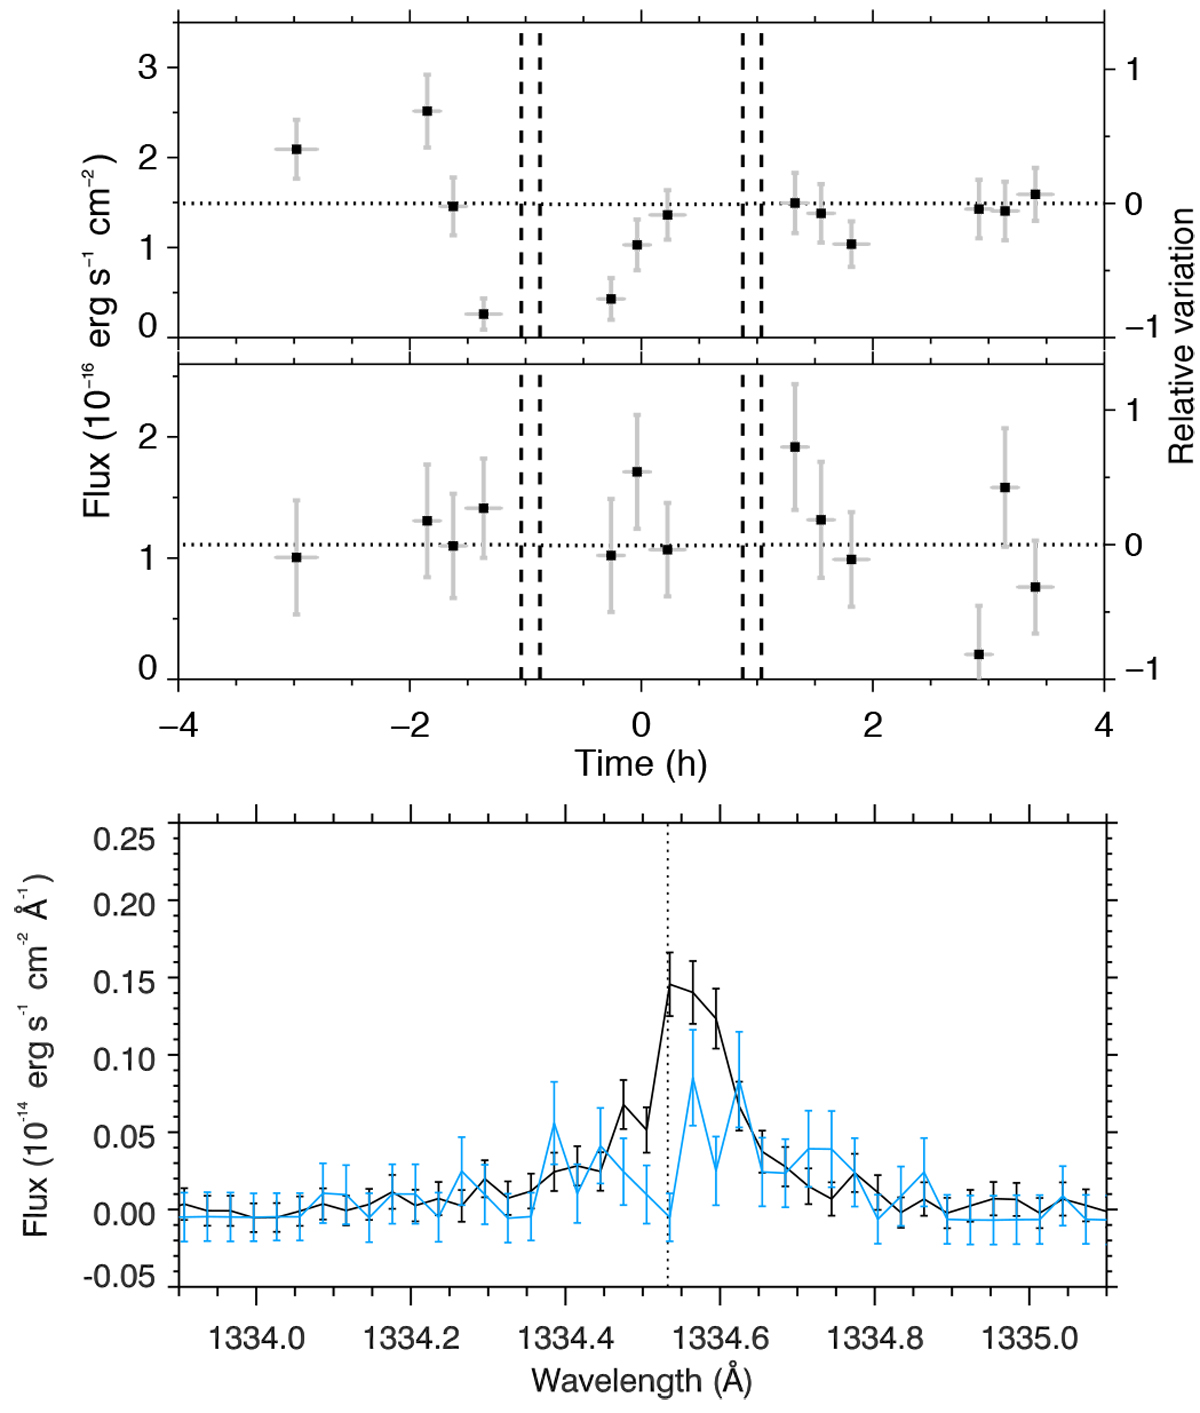
C II λ1334.5 line in Visit D. Top panel: temporal evolution of the line flux averaged over the variable range −17 to 14 km s−1 (top) and over its stable complementary range (bottom). Bottom panel: comparison between the stellar line averaged over the first, last, and second orbit (black profile), and the line averaged over the two most absorbed sub-exposures visible in the top panel (blue profile). The wavelength scale is in the expected star rest frame and has not been corrected for the 3.6 km s−1 line shift (see text).
Current usage metrics show cumulative count of Article Views (full-text article views including HTML views, PDF and ePub downloads, according to the available data) and Abstracts Views on Vision4Press platform.
Data correspond to usage on the plateform after 2015. The current usage metrics is available 48-96 hours after online publication and is updated daily on week days.
Initial download of the metrics may take a while.