Fig. 4
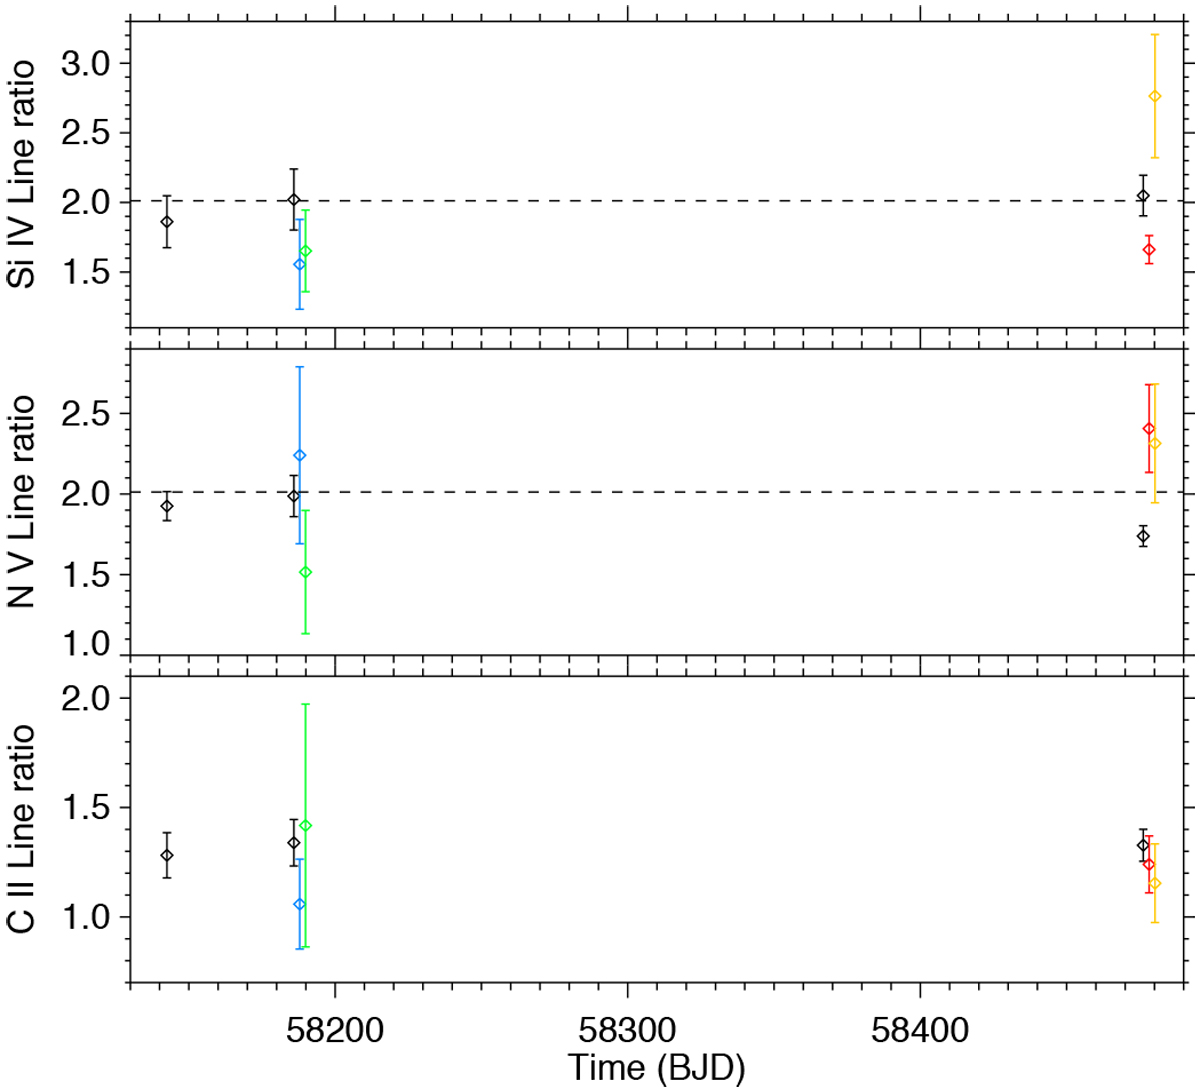
Ratios of the Si IV (λ1393.8–1402.8), N V (λ1238.8–1242.8), and C II (λ1335.7–λ1334.5) lines as a function of time in Visits D, E, and F. Black points correspond to the quiescent stellar emission. Blue and green points show the first and second flare in Visit E, while red and orange points show the peak and decay phase of the flare in Visit F, respectively. Horizontal dashed lines show the expected line ratios in an optically thin plasma for the Si IV and N V lines (the C II line ratio is at ~2.5).
Current usage metrics show cumulative count of Article Views (full-text article views including HTML views, PDF and ePub downloads, according to the available data) and Abstracts Views on Vision4Press platform.
Data correspond to usage on the plateform after 2015. The current usage metrics is available 48-96 hours after online publication and is updated daily on week days.
Initial download of the metrics may take a while.