Free Access
Fig. 3
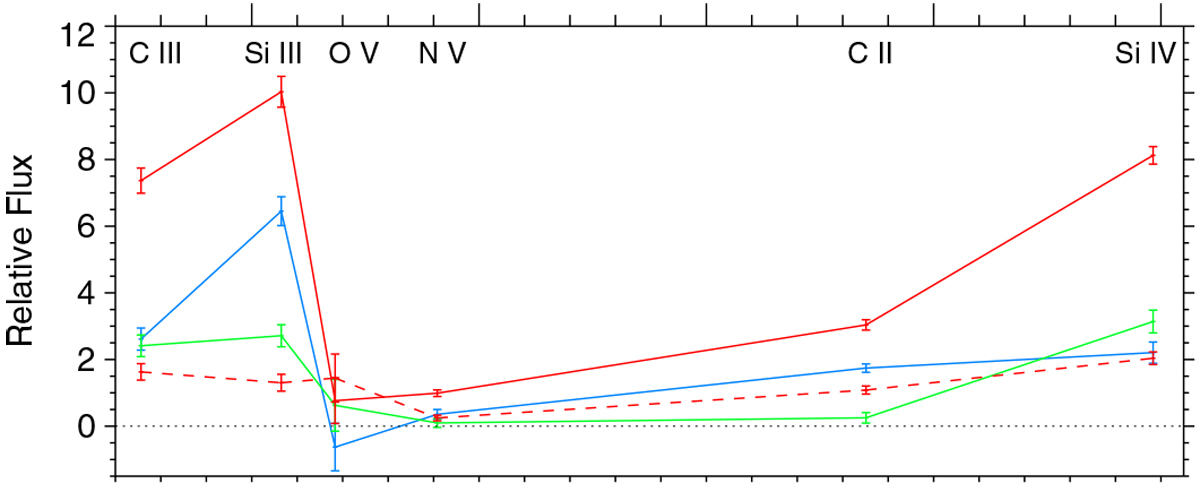
Flaring spectra of GJ 3470, relative to the quiescent stellar emission. Blue and green lines correspond to the two independentspectra measured in Visit E. Red corresponds to the flare measured in Visit F during the peak (solid line) and decay (dashed line) phases.
Current usage metrics show cumulative count of Article Views (full-text article views including HTML views, PDF and ePub downloads, according to the available data) and Abstracts Views on Vision4Press platform.
Data correspond to usage on the plateform after 2015. The current usage metrics is available 48-96 hours after online publication and is updated daily on week days.
Initial download of the metrics may take a while.