Fig. 2
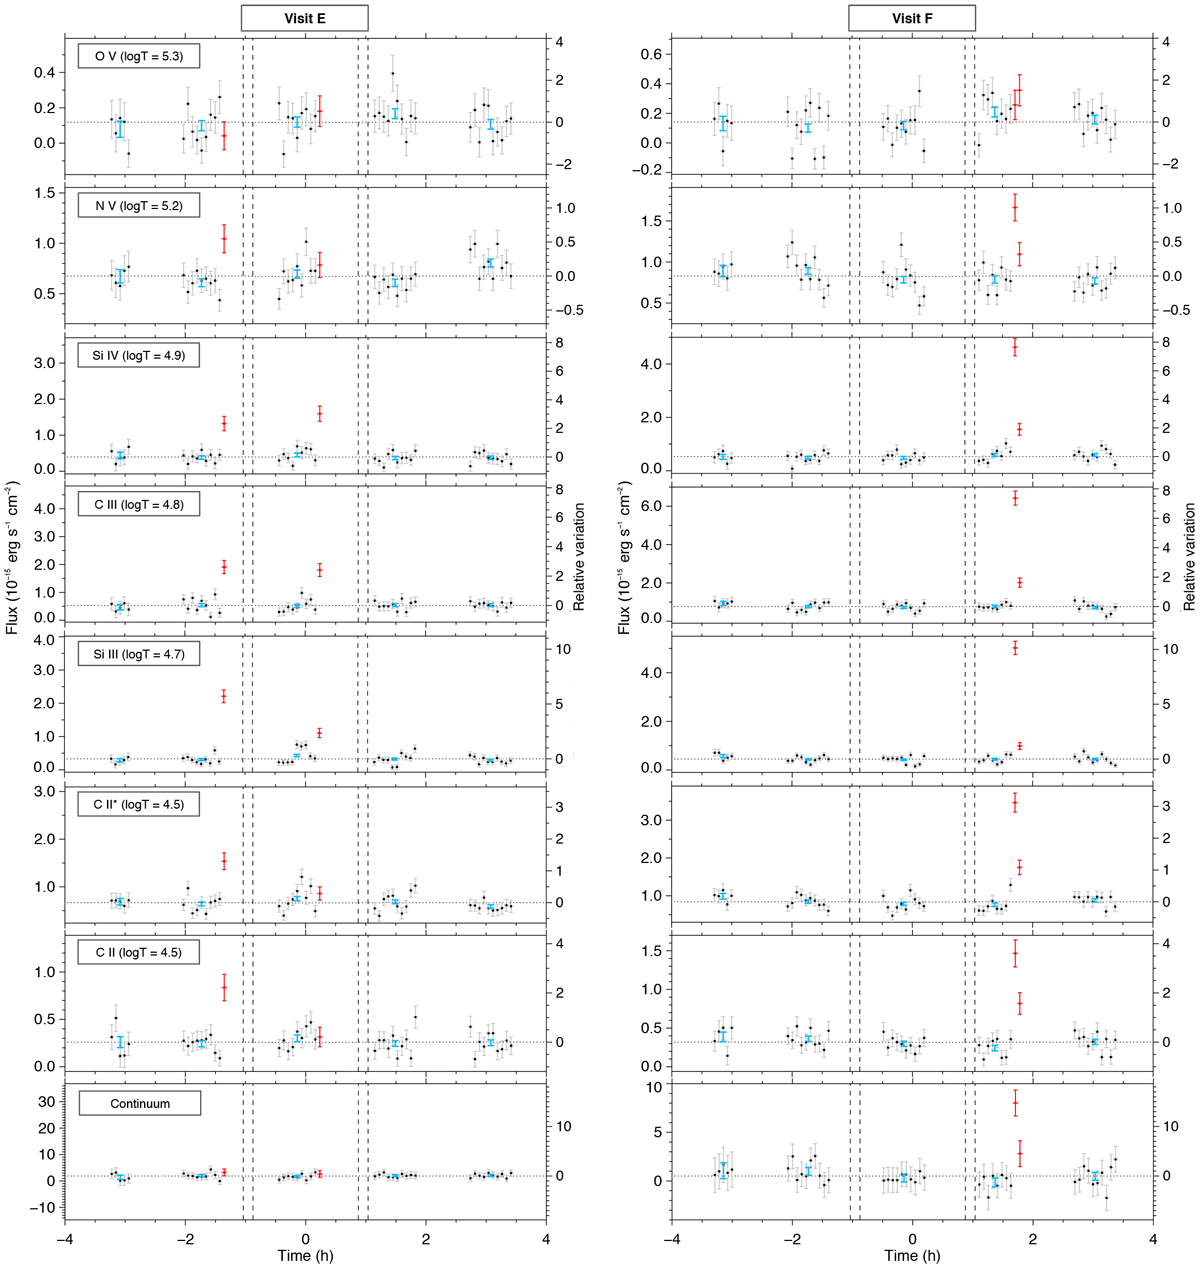
Light curves of GJ 3470 FUV lines in Visits E and F. Each row corresponds to a stellar line, ordered from top to bottom by decreasing formation temperature. Bottom row: stellar continuum measured over the full ranges of the two detectors. Blue symbols correspond to the average flux over each HST orbit, flaring sub-exposures excluded (shown in red). For consistency, all fluxes are integrated over the full breadth of the lines, even though the flares may occur in specific spectral regions for some lines (see text). Vertical dashed lines are the transit contacts (there is no evidence for the planetary transit in any of the lines). Right axes indicate flux variations relative to the quiescent flux level (horizontal dotted lines) and are the same between visits for a given line. N V and Si IV fluxes are summed over the doublet lines.
Current usage metrics show cumulative count of Article Views (full-text article views including HTML views, PDF and ePub downloads, according to the available data) and Abstracts Views on Vision4Press platform.
Data correspond to usage on the plateform after 2015. The current usage metrics is available 48-96 hours after online publication and is updated daily on week days.
Initial download of the metrics may take a while.