Fig. C.4
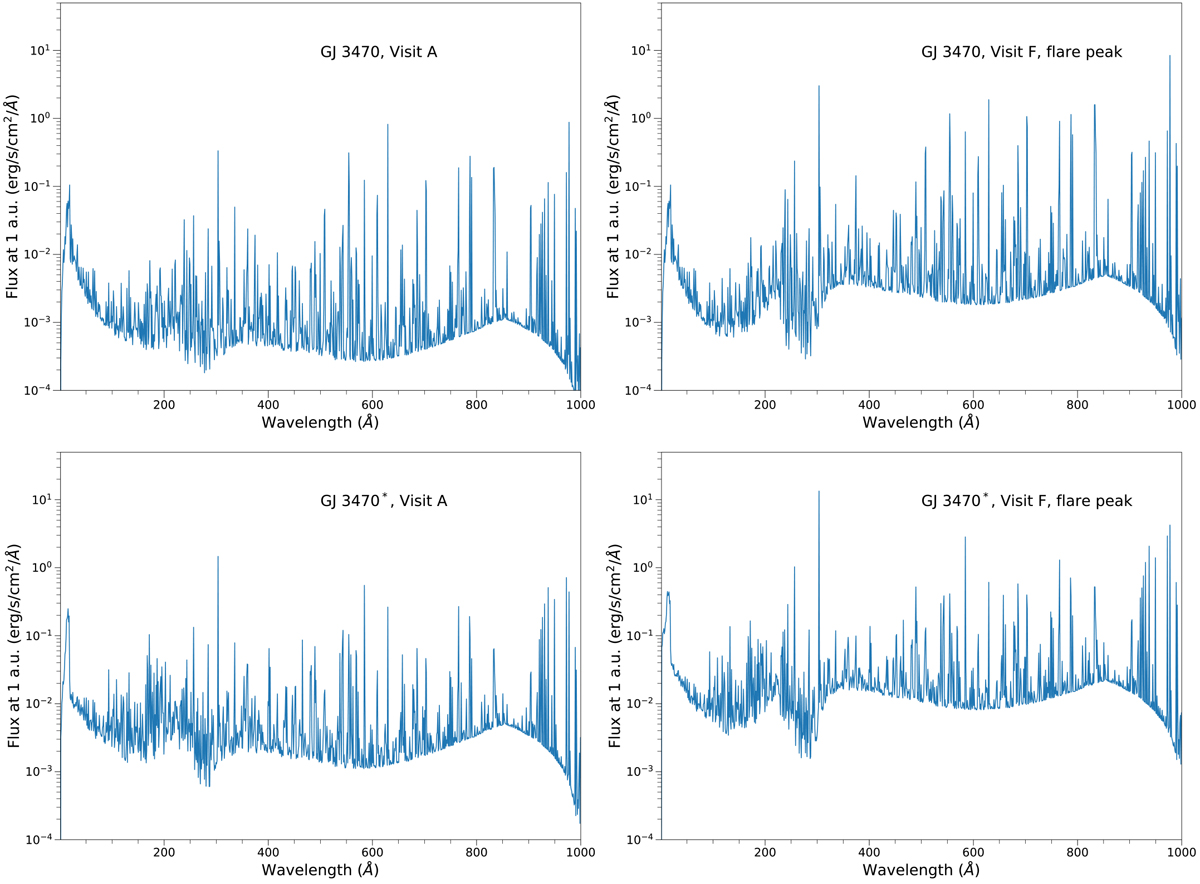
Spectral energy distribution as modeled using the EMD in Fig. C.3, shown here for the quiescent state in Visit A (left panel) and the flaring peak phase in Visit F (right panels). Upper panels use the coronal data from the XMM-Newton observation of GJ 3470 alone. Lower panels use the coronal EMD adapted from AD Leo quiescent and flaring stages. The strongest line at high energies corresponds to He II 304 Å.
Current usage metrics show cumulative count of Article Views (full-text article views including HTML views, PDF and ePub downloads, according to the available data) and Abstracts Views on Vision4Press platform.
Data correspond to usage on the plateform after 2015. The current usage metrics is available 48-96 hours after online publication and is updated daily on week days.
Initial download of the metrics may take a while.