Fig. C.3
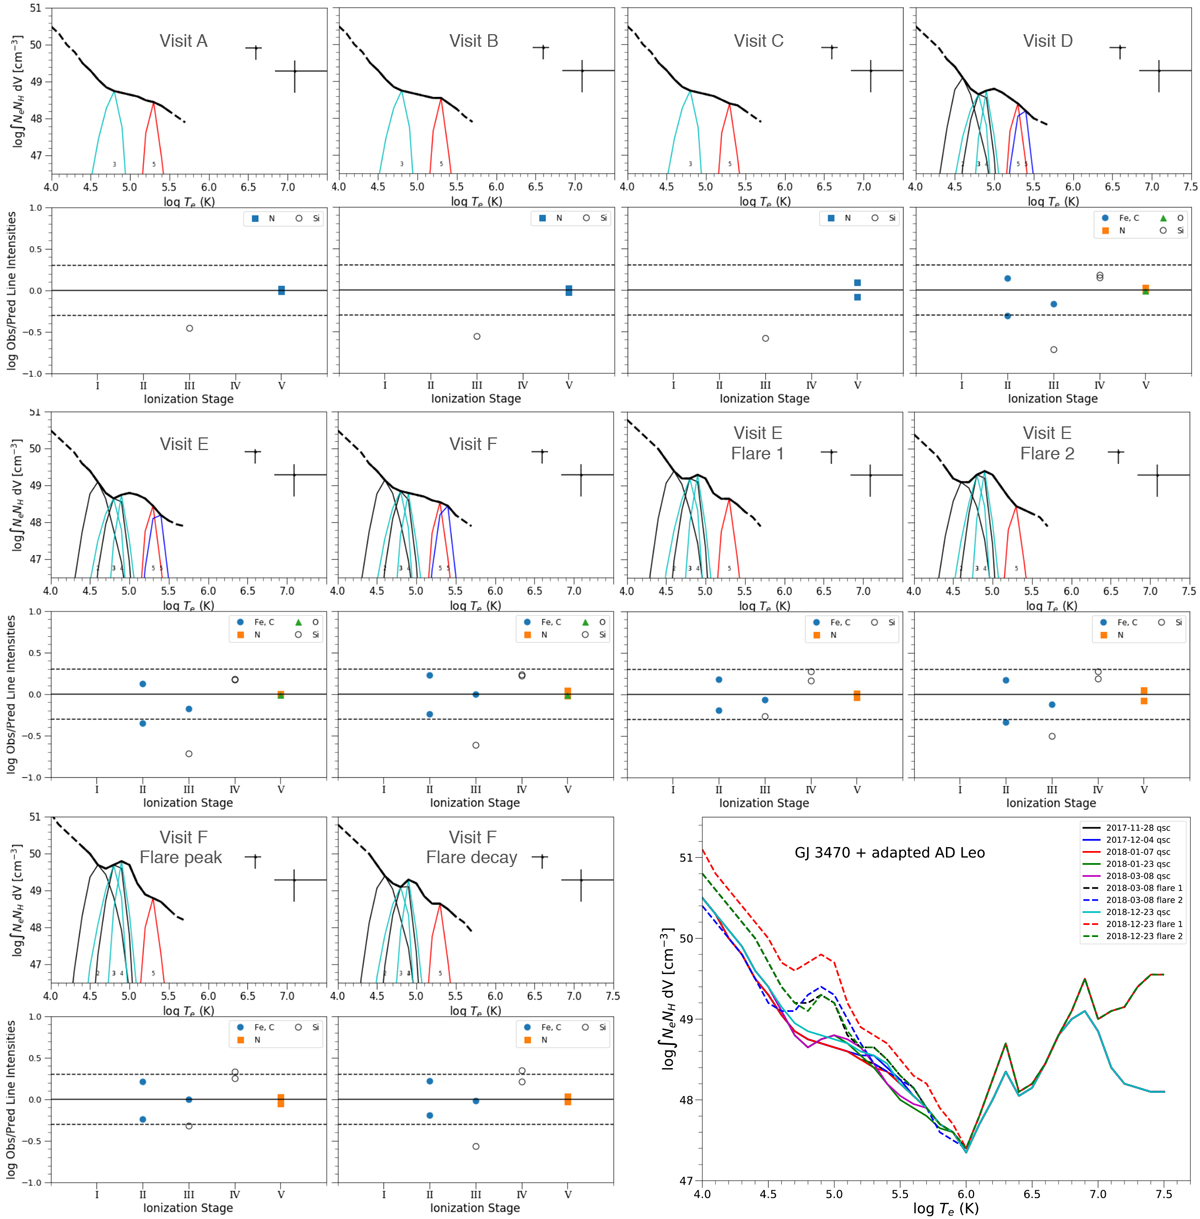
EMDs of GJ 3470 during the different stages. The coronal model is based on UV lines (log T < 6.0) and the X-ray XMM-Newton/EPIC spectral fit (logT > 6.0) from Bourrier et al. (2018a). Upper subpanels: EMD indicated by thick black line based on UV lines and two discrete temperatures with error bars based on the X-ray spectral fit. Thin colored lines represent the emissivities of the different lines, weighted by the EMD, with ionization stages displayed in small numbers below the lines. Lower subpanels: line flux ratios between the observed line fluxes and those predicted by the combination of the EMD and the atomic data, following Sanz-Forcada et al. (2011) and references therein. The plot in the lower right corner shows all EMDs together for the coronal model based on the combined GJ 3470 and AD Leo X-ray data, as explained in the text. We note that the AD Leodata only provide a flaring and a quiescent stage.
Current usage metrics show cumulative count of Article Views (full-text article views including HTML views, PDF and ePub downloads, according to the available data) and Abstracts Views on Vision4Press platform.
Data correspond to usage on the plateform after 2015. The current usage metrics is available 48-96 hours after online publication and is updated daily on week days.
Initial download of the metrics may take a while.