Fig. C.1
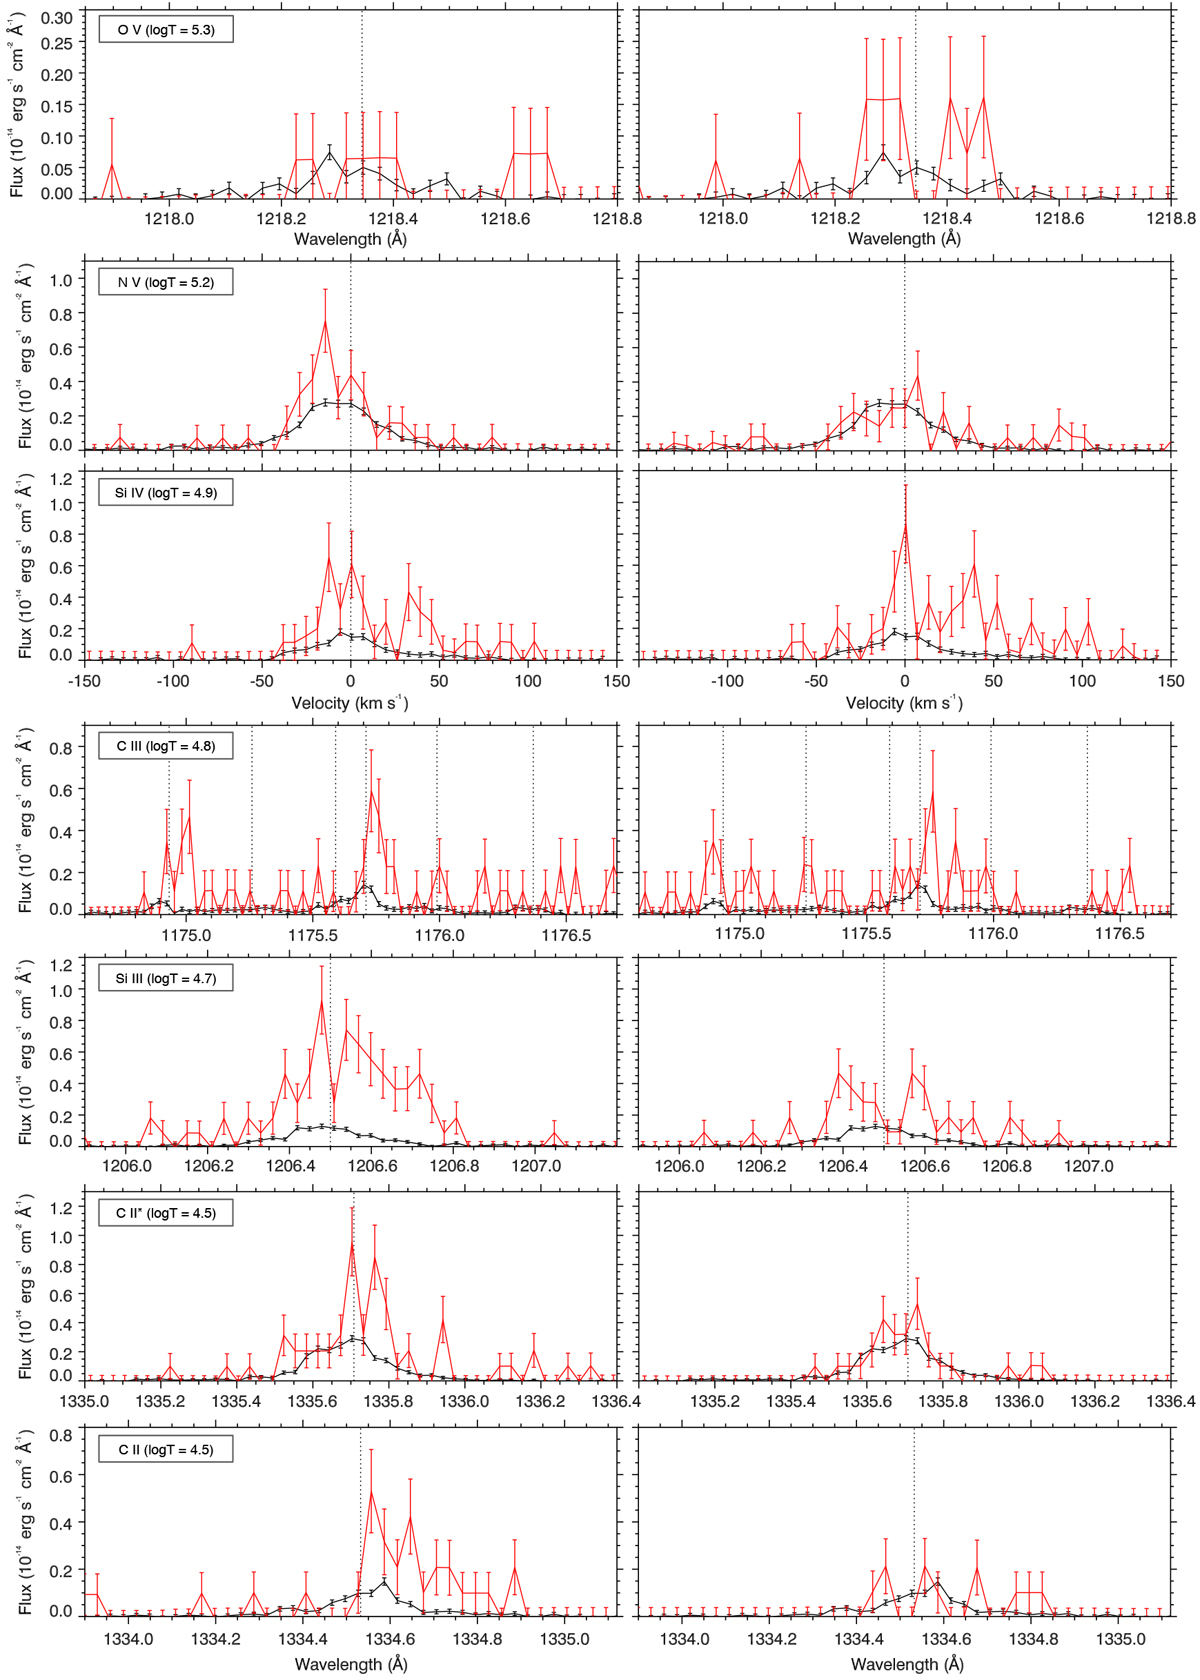
Spectral profiles of GJ 3470 FUV lines in Visit E. Each row corresponds to a stellar line, ordered from top to bottom by decreasing formation temperature. Black profiles show quiescent stellar lines. Red profiles correspond to the flaring exposures in the second (left column) and third (right column) HST orbits of the visit. Lines are plotted as a function of wavelength in the expected stellar rest frame. The N V and Si IV doublets have been coadded and are plotted in velocity space. Vertical dashed lines correspond to the expected rest position of the stellar lines.
Current usage metrics show cumulative count of Article Views (full-text article views including HTML views, PDF and ePub downloads, according to the available data) and Abstracts Views on Vision4Press platform.
Data correspond to usage on the plateform after 2015. The current usage metrics is available 48-96 hours after online publication and is updated daily on week days.
Initial download of the metrics may take a while.