Fig. A.1
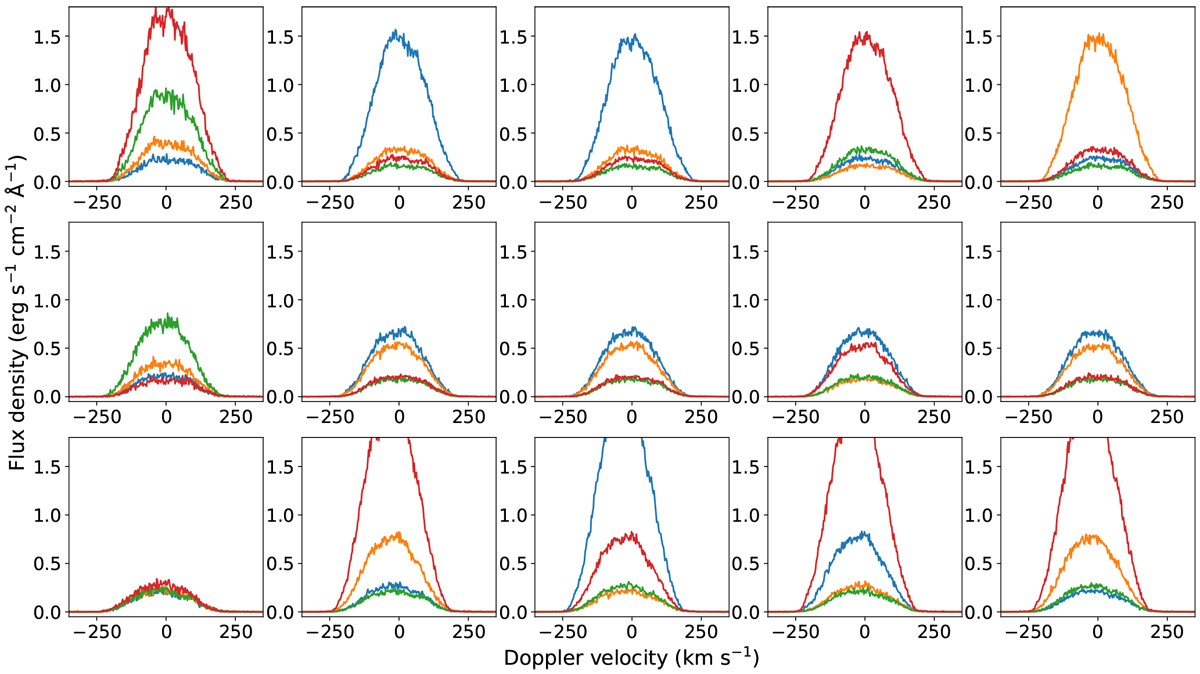
Spectral profiles of GJ 3470’s Lyman-α line as observed with COS, still contaminated by geocoronal emission. From top to bottom: the rows correspond to Visits D, E, and F. Successive orbits in each visit are plotted from left to right. Each HST orbit is cut into four sub-exposures, plotted in blue, orange, green, and red, with increasing phase. Spectra are shown in the COS rest frame.
Current usage metrics show cumulative count of Article Views (full-text article views including HTML views, PDF and ePub downloads, according to the available data) and Abstracts Views on Vision4Press platform.
Data correspond to usage on the plateform after 2015. The current usage metrics is available 48-96 hours after online publication and is updated daily on week days.
Initial download of the metrics may take a while.