Fig. 12
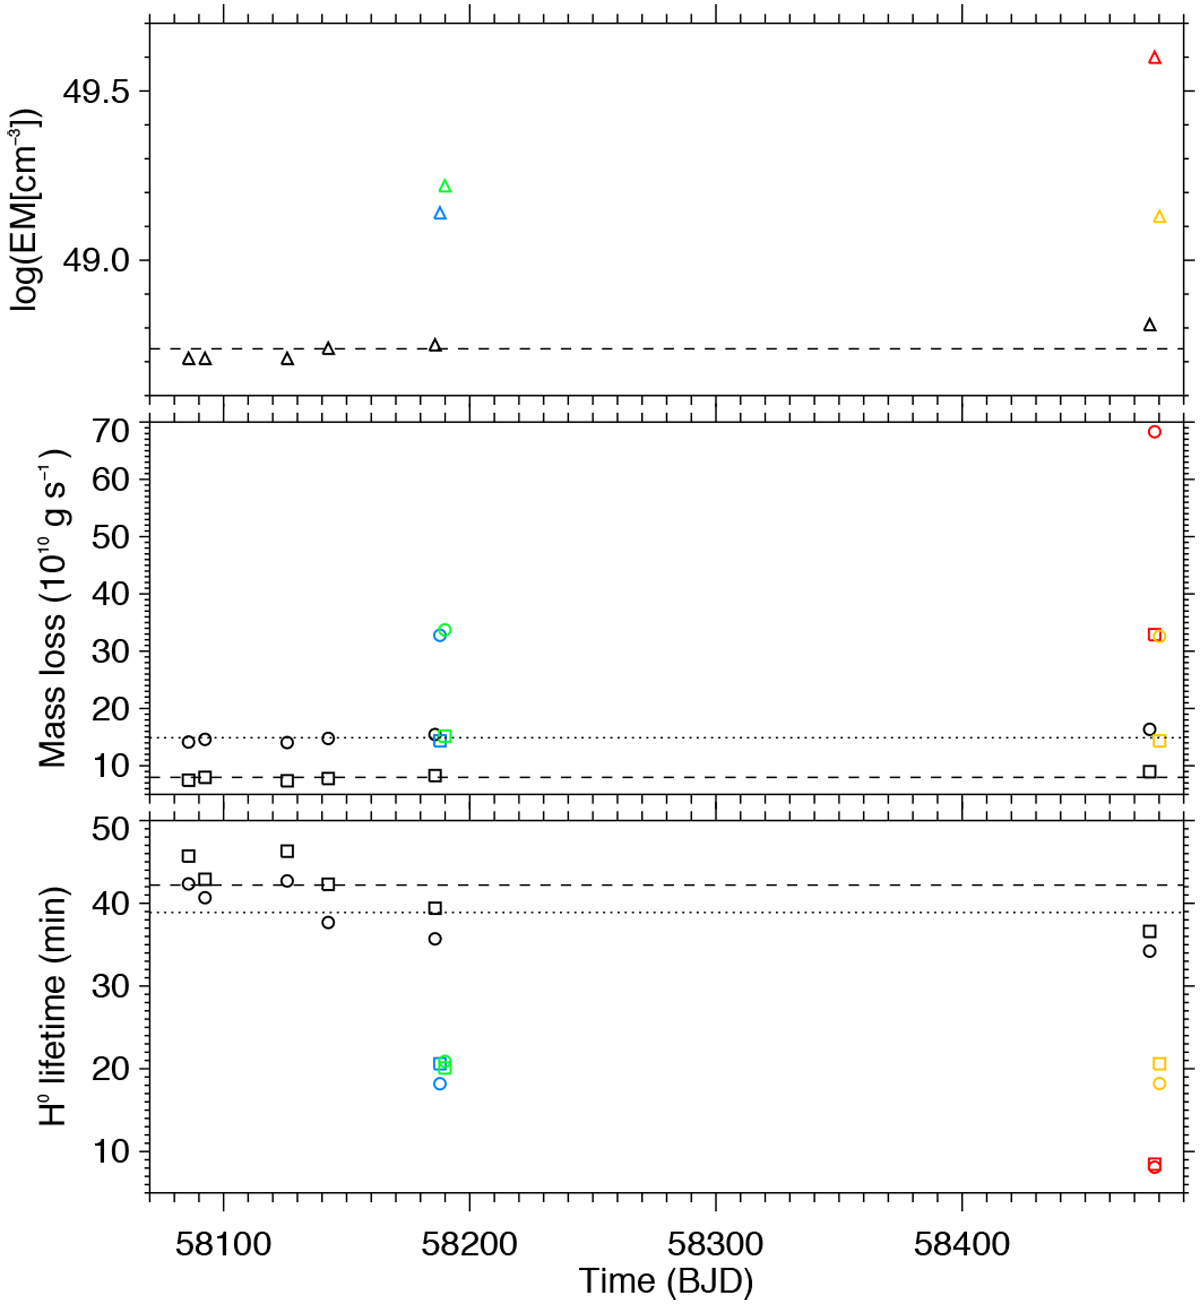
Average emission measures (logEM(cm−3)) in the range logT(K) = 4.7−5.1 (upper panel), maximum energy-limited mass loss (middle panel), and photo-ionization lifetime of neutral hydrogen (lower panel) as a function of time. Black points correspond to the quiescent stellar emission. Blue and green points show the first and second flare in Visit E, while red and orange points show the peak and decay phase of the flare in Visit F, respectively. Squares and circles correspond, respectively, to the EMD based on GJ 3470 alone and the combined GJ 3470 and AD Leo (emission measures in the plotted temperature range are the same in both cases). Horizontal and dotted dashed lines show the respective averages over quiescent values.
Current usage metrics show cumulative count of Article Views (full-text article views including HTML views, PDF and ePub downloads, according to the available data) and Abstracts Views on Vision4Press platform.
Data correspond to usage on the plateform after 2015. The current usage metrics is available 48-96 hours after online publication and is updated daily on week days.
Initial download of the metrics may take a while.