Fig. 11
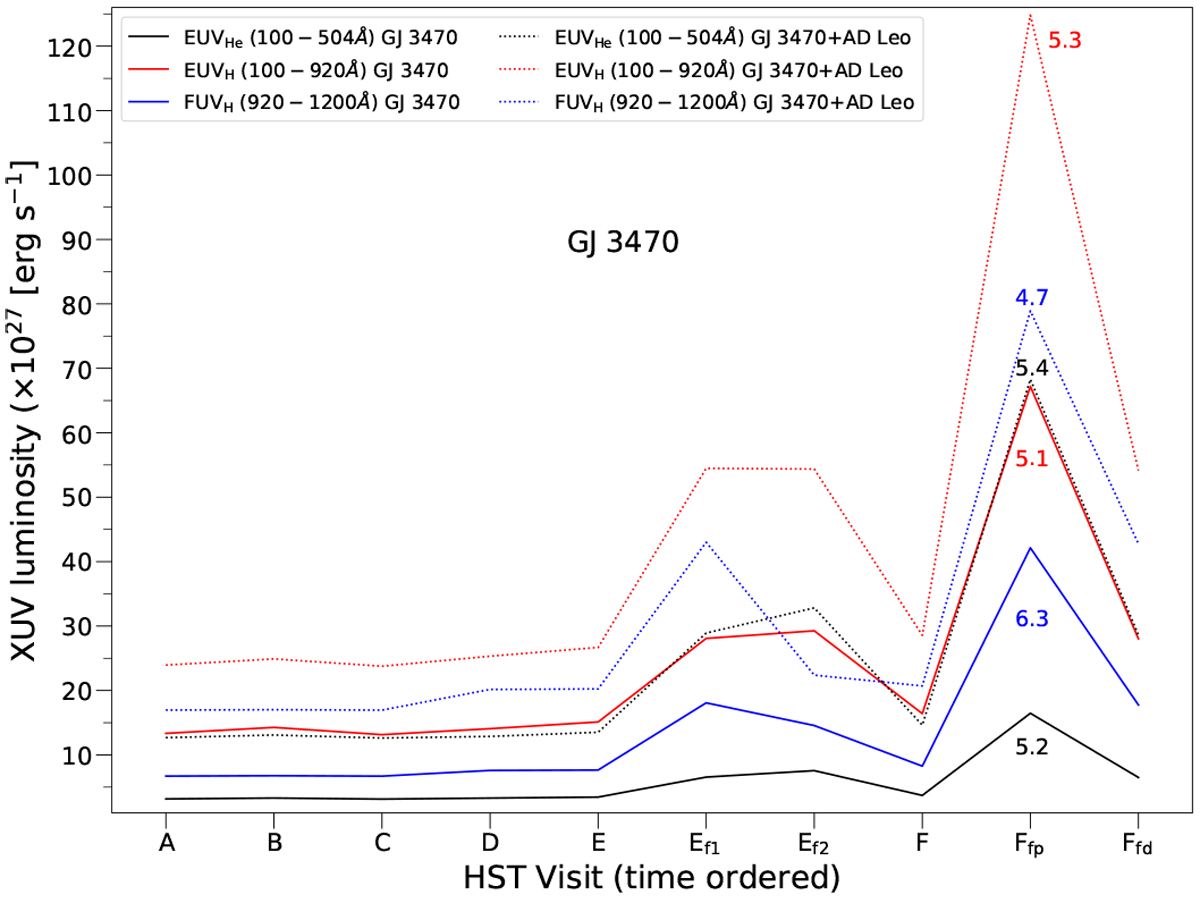
Synthetic fluxes at 1 au from GJ 3470 in the FUV and two EUV bands as a function of time. We distinguish the fluxes calculated with the EMD model of GJ 3470 alone (solid lines) and the EMD model of the combined GJ 3470 and AD Leo (dotted lines). Numbers over the flare peaks indicate the maximum-to-minimum ratio of the curves in each band. We note that variations in X-rays (5–100 Å, not shown here) are limited to two main values in the case of the combined EMD (5.7 × 1027 erg s−1, quiescent; 1.8 × 1028 erg s−1, flares), while it is almost constant for all intervals in the EMD of GJ 3470 alone (2.3 × 1027).
Current usage metrics show cumulative count of Article Views (full-text article views including HTML views, PDF and ePub downloads, according to the available data) and Abstracts Views on Vision4Press platform.
Data correspond to usage on the plateform after 2015. The current usage metrics is available 48-96 hours after online publication and is updated daily on week days.
Initial download of the metrics may take a while.