Free Access
Fig. 1
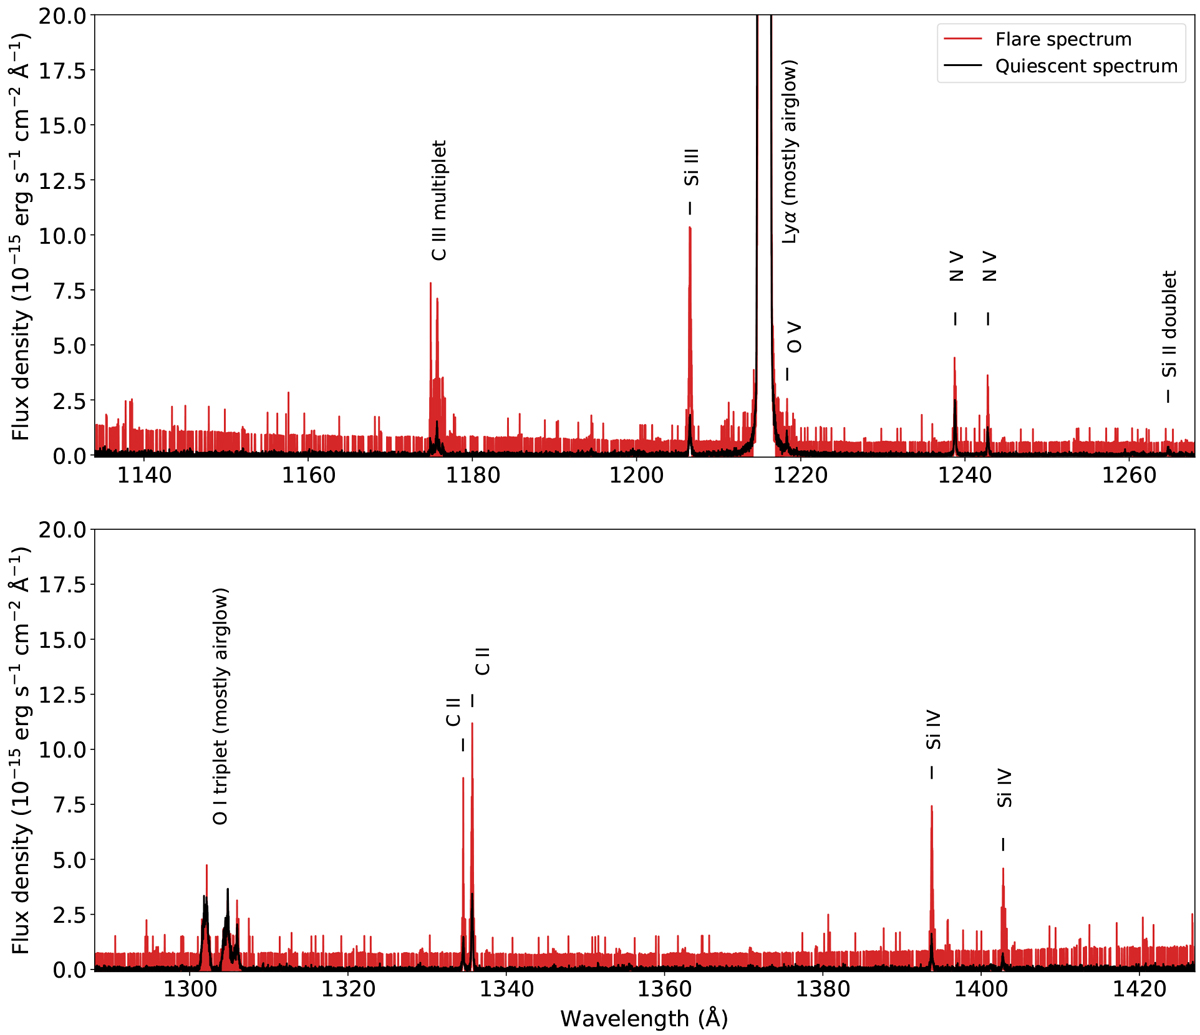
COS spectrum of GJ 3470, plotted as a function of wavelength in the star rest frame and averaged over Visits E and F. Flare brightenings are visible in most of the measured emission lines.
Current usage metrics show cumulative count of Article Views (full-text article views including HTML views, PDF and ePub downloads, according to the available data) and Abstracts Views on Vision4Press platform.
Data correspond to usage on the plateform after 2015. The current usage metrics is available 48-96 hours after online publication and is updated daily on week days.
Initial download of the metrics may take a while.