Fig. 8
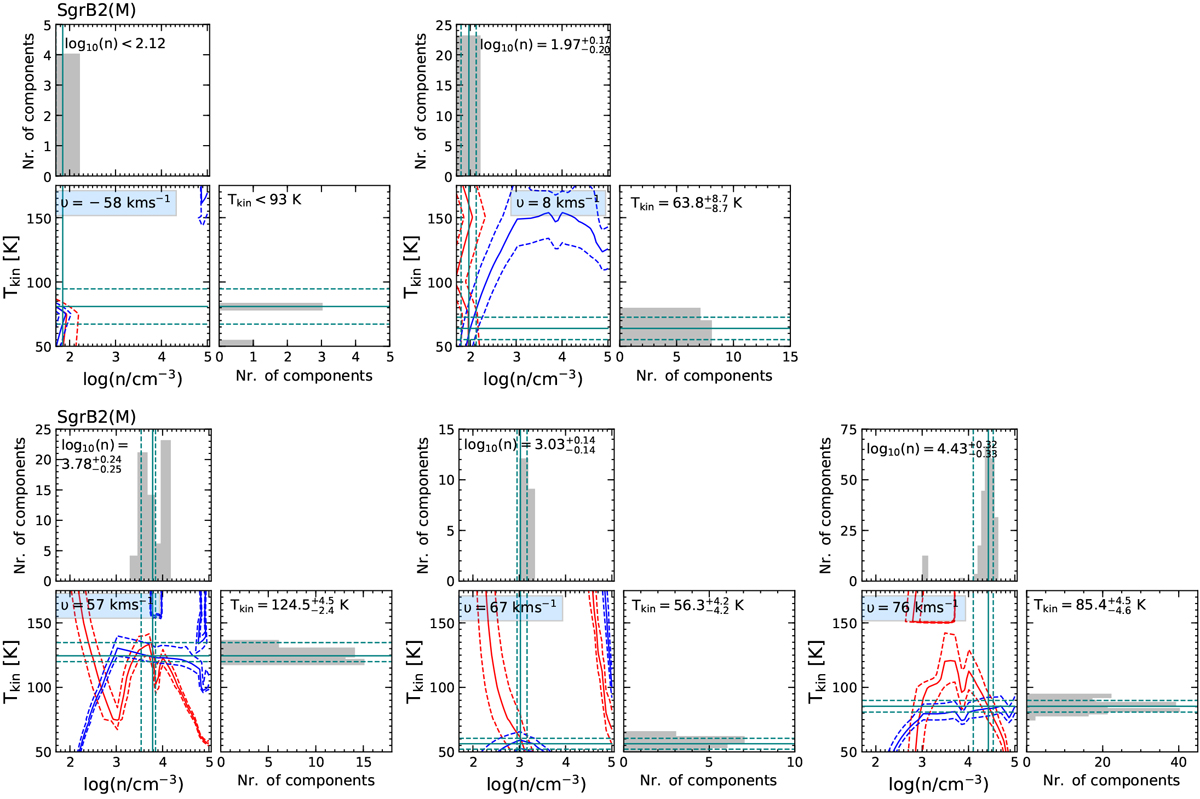
Clockwise from the top left: MOLPOP-CEP non-LTE radiative-transfer modelling of the CH ground-state transitions towards Sgr B2 (M) for LOS velocity components at −58, and +8 km s−1 followed by those associated with the envelope at υLSR = +76, +67, and +57 km s−1, respectively. Displayed in red and blue curves (central plot) are the modelled line ratios which best reproduce the observed line ratios between the 3.264 GHz, and 3.349 GHz lines and those between the 3.335 GHz and 3.349 GHz lines and their uncertainties, respectively, as a function of n and Tkin. The corner plots display the gas density and temperature distributions as governed by the 3 σ level of the minimum χ2 with the median and standard deviation marked by the solid and dashed teal lines, respectively.
Current usage metrics show cumulative count of Article Views (full-text article views including HTML views, PDF and ePub downloads, according to the available data) and Abstracts Views on Vision4Press platform.
Data correspond to usage on the plateform after 2015. The current usage metrics is available 48-96 hours after online publication and is updated daily on week days.
Initial download of the metrics may take a while.