Fig. 4
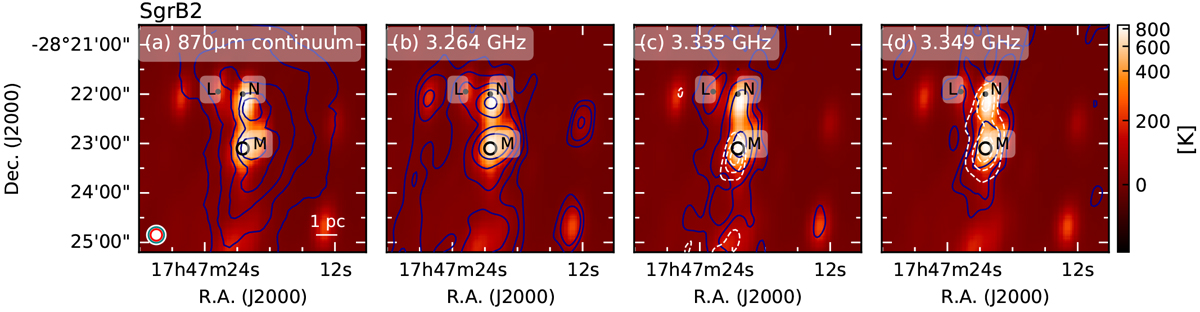
Overview of the 3.3 GHz CH line observations towards Sgr B2. Panel (a) displays the ATLASGAL 870 μm emission at contour levels starting from 5×, 10×, 20×, 40× and 80 × 1σ where 1σ = 0.9 Jy beam−1 overlaid atop the 3.3 GHz continuum emission along with the synthesised beam of the VLA observations (filled white circle) as well as the central beam of upGREAT/SOFIA (red) and the LABOCA/APEX beam (teal), for comparison. The position from which the spectra are extracted is marked by the beam in black and labelled M; we also mark the positions of Sgr B2 (N) and (L). Panels (b), (c), and (d) display the integrated intensity contours of the 3.264 GHz, 3.335 GHz, and 3.349 GHz CH lines, respectively, overlaid on top of the3.3 GHz continuum emission. The intensities are integrated over a velocity range between 48 and 83 km s−1 except for that of the 3.335 GHz and 3.349 GHz CH maps, for which the emission components are integrated between 48 and 62 km s−1 while the absorption between 62 and 84 km s−1. The contour levels mark 5×, 10×, 20×, 40×, and 80 × 1σ where 1σ = 10.6, 2.65, and 2.65 K km s−1 for the 3.264 GHz, 3.335 GHz, and 3.349 GHz CH emission components, respectively (solid dark blue curves) and the 3×, 4×, and 5 ×1σ levels where 1σ = 2.12 K km s−1 for the 3.335 GHz and 3.349 GHz CH absorption components (dashed white curves).
Current usage metrics show cumulative count of Article Views (full-text article views including HTML views, PDF and ePub downloads, according to the available data) and Abstracts Views on Vision4Press platform.
Data correspond to usage on the plateform after 2015. The current usage metrics is available 48-96 hours after online publication and is updated daily on week days.
Initial download of the metrics may take a while.