Fig. 13
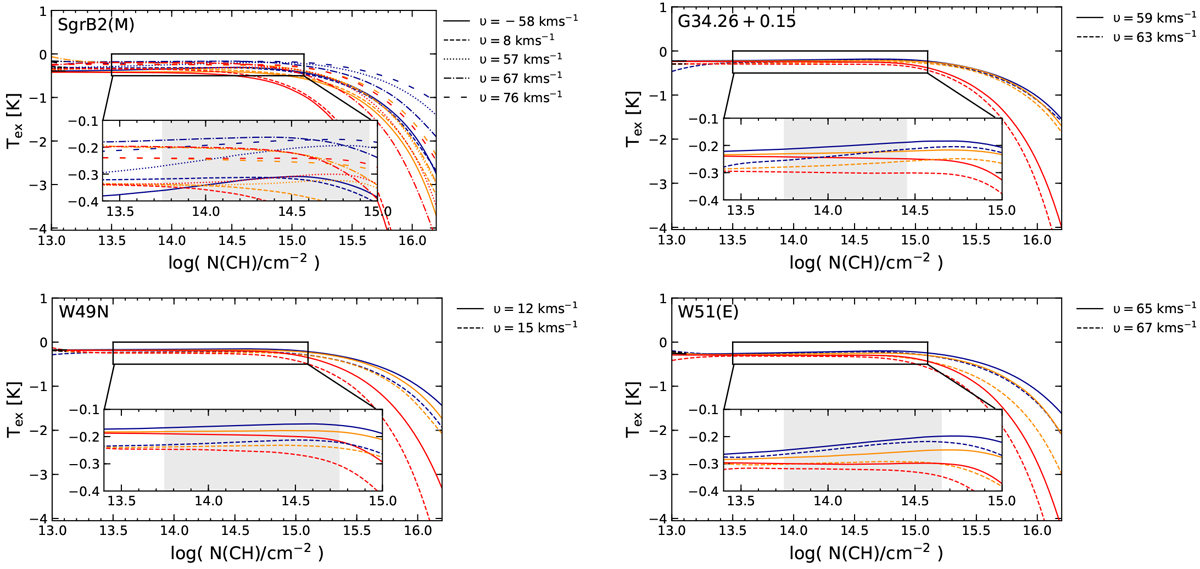
Clockwise from top-left: modelled excitation temperatures of the 3.264 GHz (dark blue), 3.349 GHz (dark orange), and 3.335 GHz (red) ground-state transitions of CH as a function of CH column densities for the physical conditions derived for the different velocity components towards Sgr B2 (M), G34.26+0.15, W51 E, and W49 (N). The differing line styles are used to indicate results for the different velocity components as labelled. The inset panels expand on the Tex values for CH column densities between 3 × 10¹³ and 1015 cm−2 and the greyshaded regions highlight the column density intervals relevant to the velocity components in each respective source.
Current usage metrics show cumulative count of Article Views (full-text article views including HTML views, PDF and ePub downloads, according to the available data) and Abstracts Views on Vision4Press platform.
Data correspond to usage on the plateform after 2015. The current usage metrics is available 48-96 hours after online publication and is updated daily on week days.
Initial download of the metrics may take a while.