Fig. 12
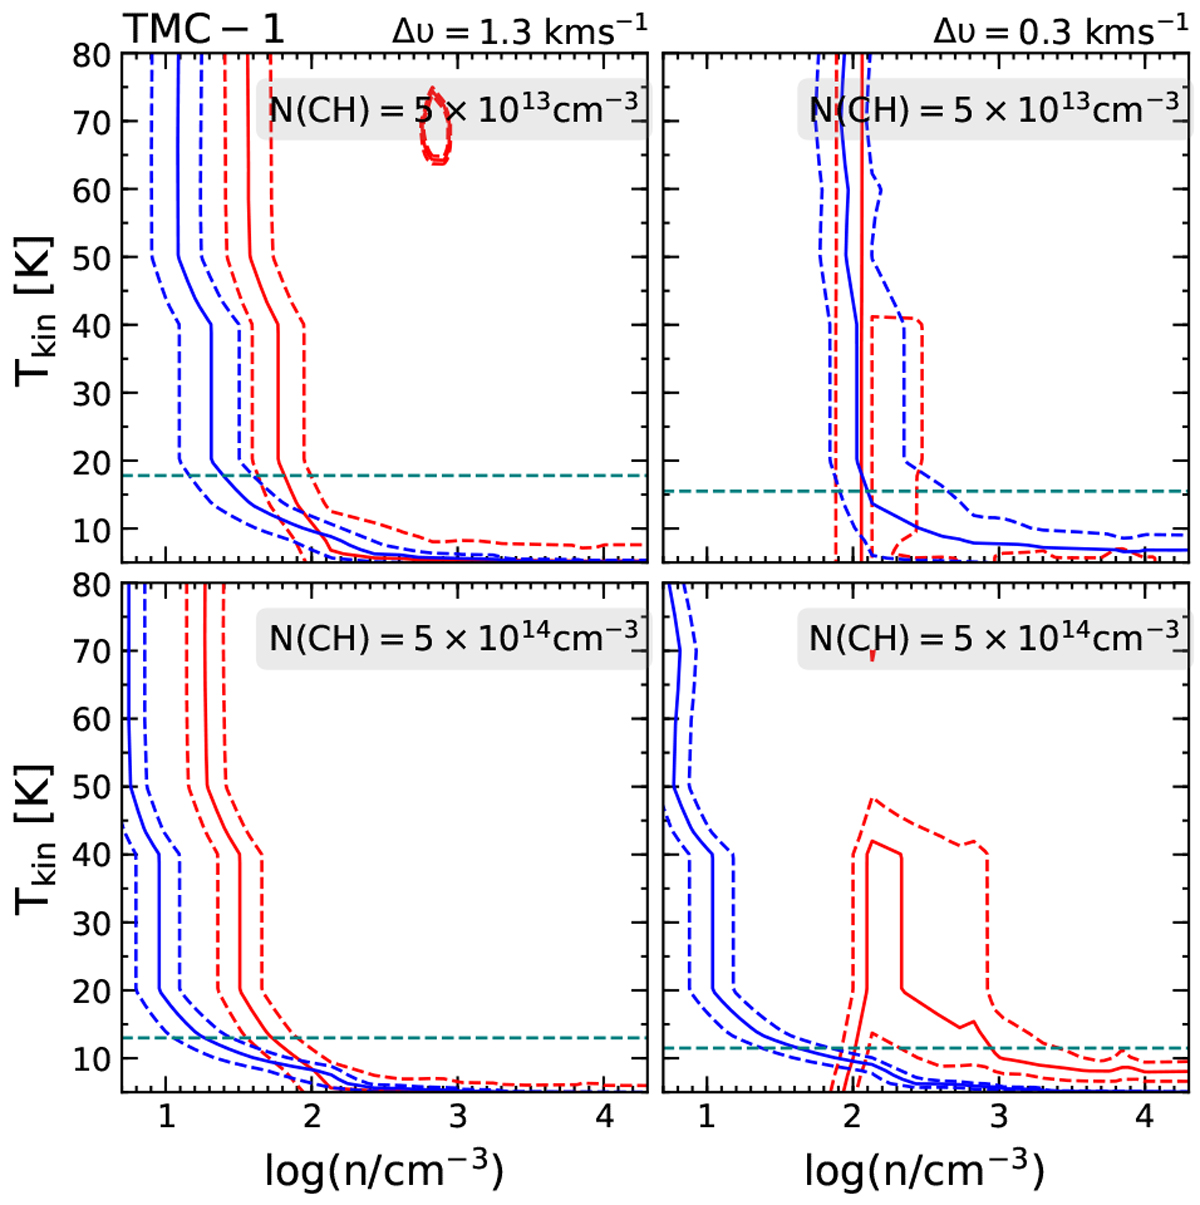
MOLPOP-CEP non-LTE radiative-transfer modelling of the CH ground-state transitions towards the broad (left) and narrow (right) velocity components observed towards the CP in TMC-1 for N(CH) = 5 × 1013 cm−2 (top panel) and 5 × 1014 cm−2 (bottom panel). Displayed in red and blue solid and dashed curves are the modelled line ratios which best reproduce the observed line ratios between the 3.264 GHz and 3.349 GHz lines and the 3.335 GHz and 3.349 GHz lines and their uncertainties, respectively, as a function of n and Tkin. The dashed teal line marks the upper limit for the gas temperatures for the broad and narrow features.
Current usage metrics show cumulative count of Article Views (full-text article views including HTML views, PDF and ePub downloads, according to the available data) and Abstracts Views on Vision4Press platform.
Data correspond to usage on the plateform after 2015. The current usage metrics is available 48-96 hours after online publication and is updated daily on week days.
Initial download of the metrics may take a while.