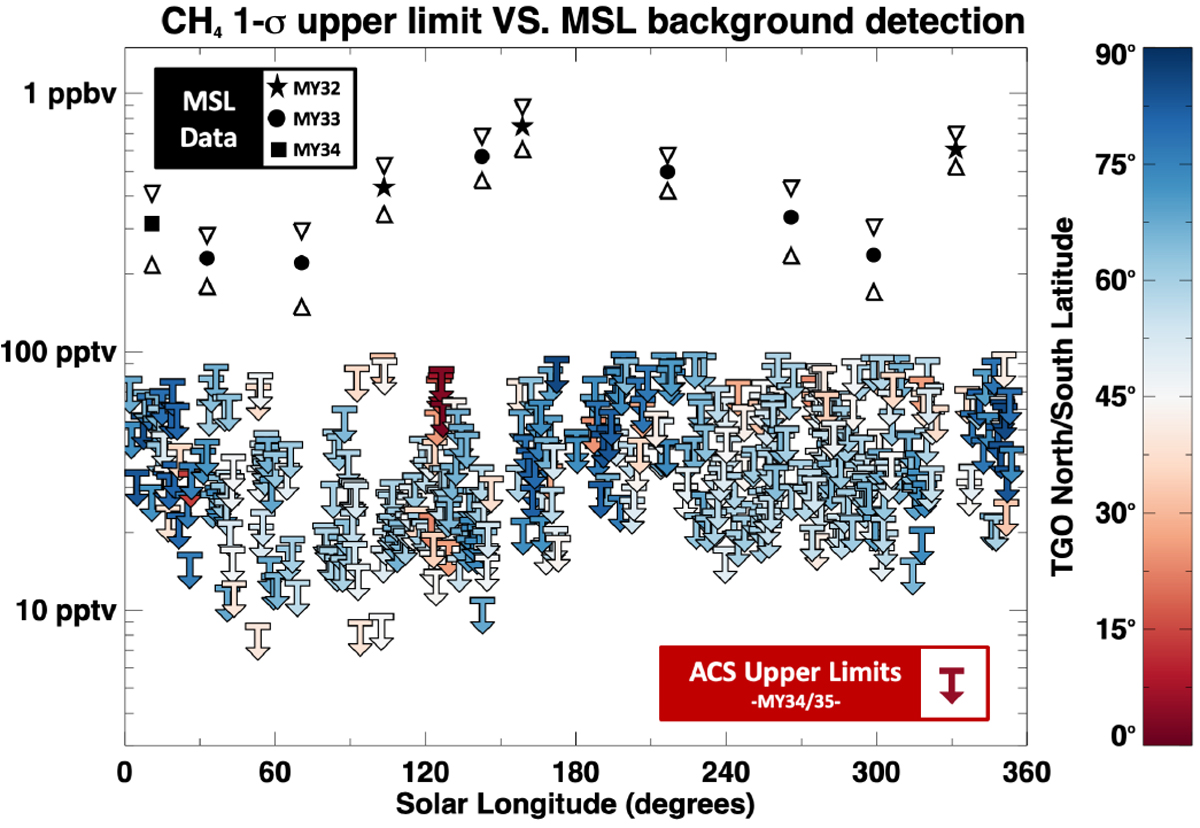
Fig. 8

Annual evolution of the best 1σ upper limits (clipped at 100 pptv) derived at each occultation and plotted as a function of Solar longitude (Ls). Upper limit symbols (downward arrows) are coloured depending on their latitude. The values reported by MSL in Webster et al. (2018) concerning the background detections of methane are shown as filled stars (MY32), circles (MY33), and squares (MY34) with their associated error bars.
Current usage metrics show cumulative count of Article Views (full-text article views including HTML views, PDF and ePub downloads, according to the available data) and Abstracts Views on Vision4Press platform.
Data correspond to usage on the plateform after 2015. The current usage metrics is available 48-96 hours after online publication and is updated daily on week days.
Initial download of the metrics may take a while.


