Open Access
Fig. 5
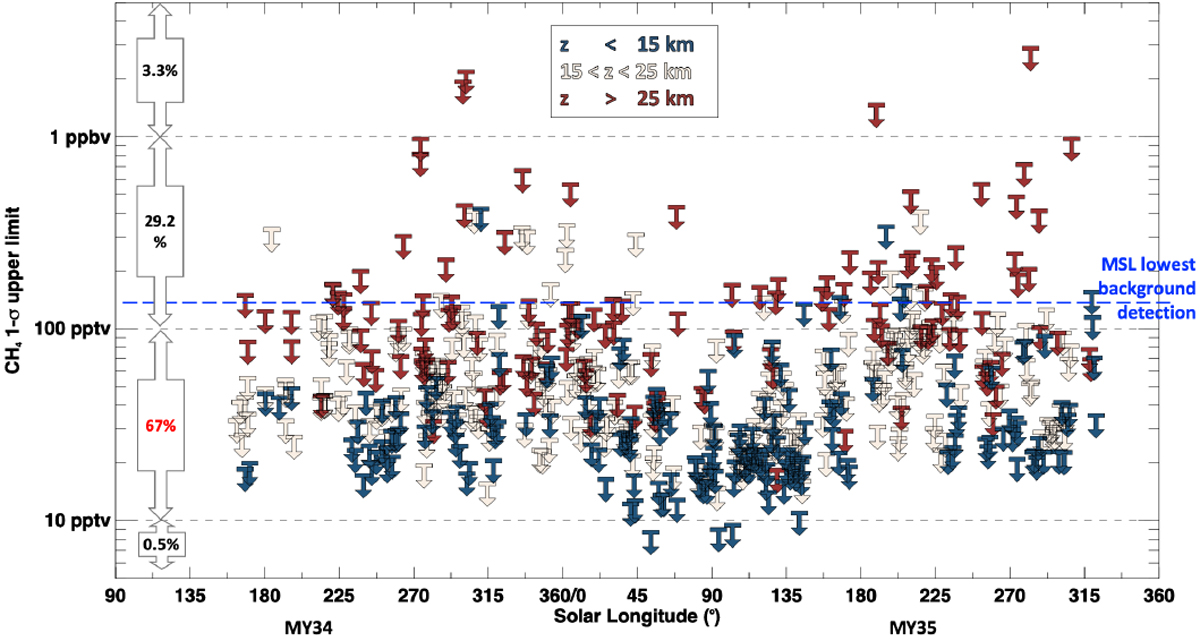
Altitude distribution of 1σ upper limits derived by ACS in three latitudinal regions: (A) mid-to-high southern latitudes, (B) inter-tropical latitudes, and (C) mid-to-high northern latitudes. The blue-to-red colour palette reflects the increasing density of points.
Current usage metrics show cumulative count of Article Views (full-text article views including HTML views, PDF and ePub downloads, according to the available data) and Abstracts Views on Vision4Press platform.
Data correspond to usage on the plateform after 2015. The current usage metrics is available 48-96 hours after online publication and is updated daily on week days.
Initial download of the metrics may take a while.