Fig. 5.
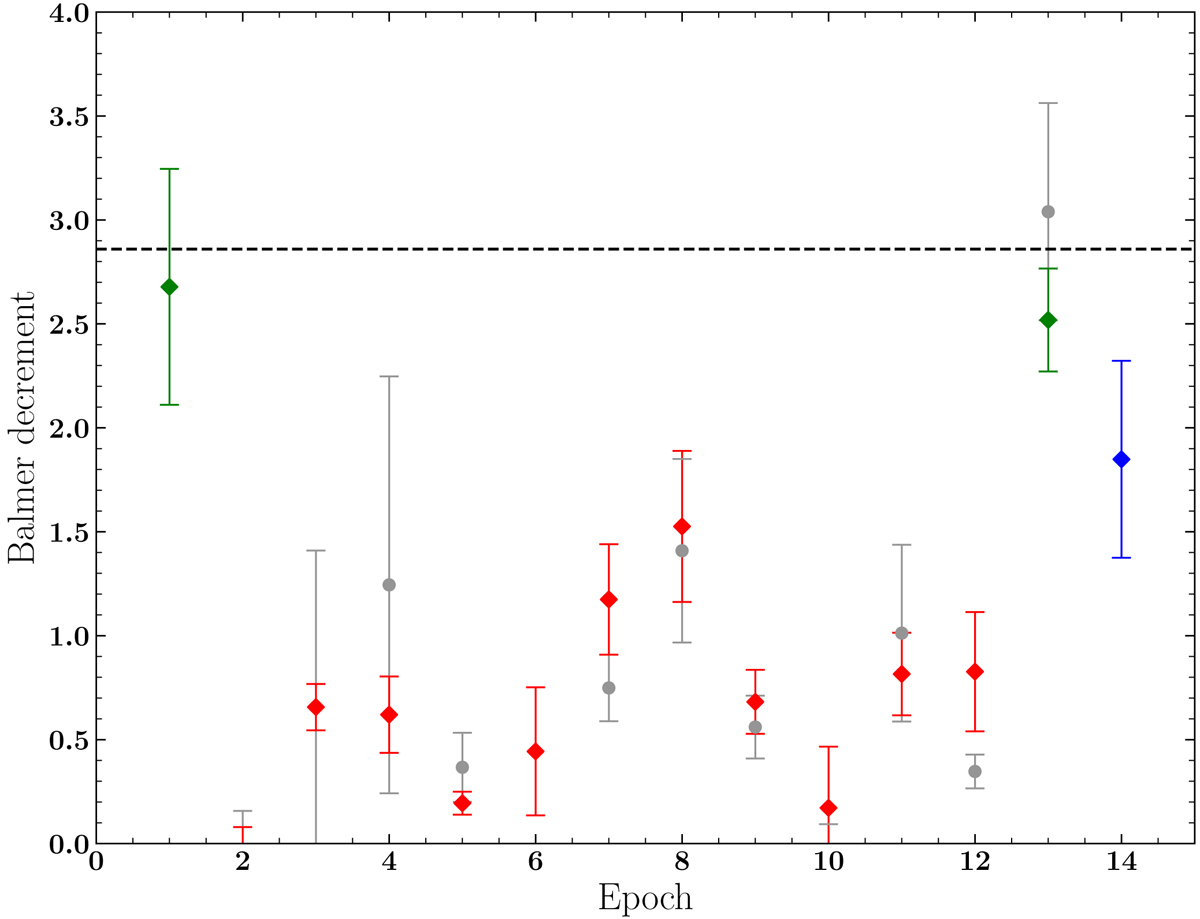
Evolution of the Balmer decrement. Grey dots were computed by estimating the Hβ flux as twice the blue half flux. Coloured dots (following the colour code in Fig. 1) were derived by adding a Gaussian component to the continuum fitting process (see text). The black dashed line indicates case B recombination (Osterbrock 1989).
Current usage metrics show cumulative count of Article Views (full-text article views including HTML views, PDF and ePub downloads, according to the available data) and Abstracts Views on Vision4Press platform.
Data correspond to usage on the plateform after 2015. The current usage metrics is available 48-96 hours after online publication and is updated daily on week days.
Initial download of the metrics may take a while.