Fig. 1.
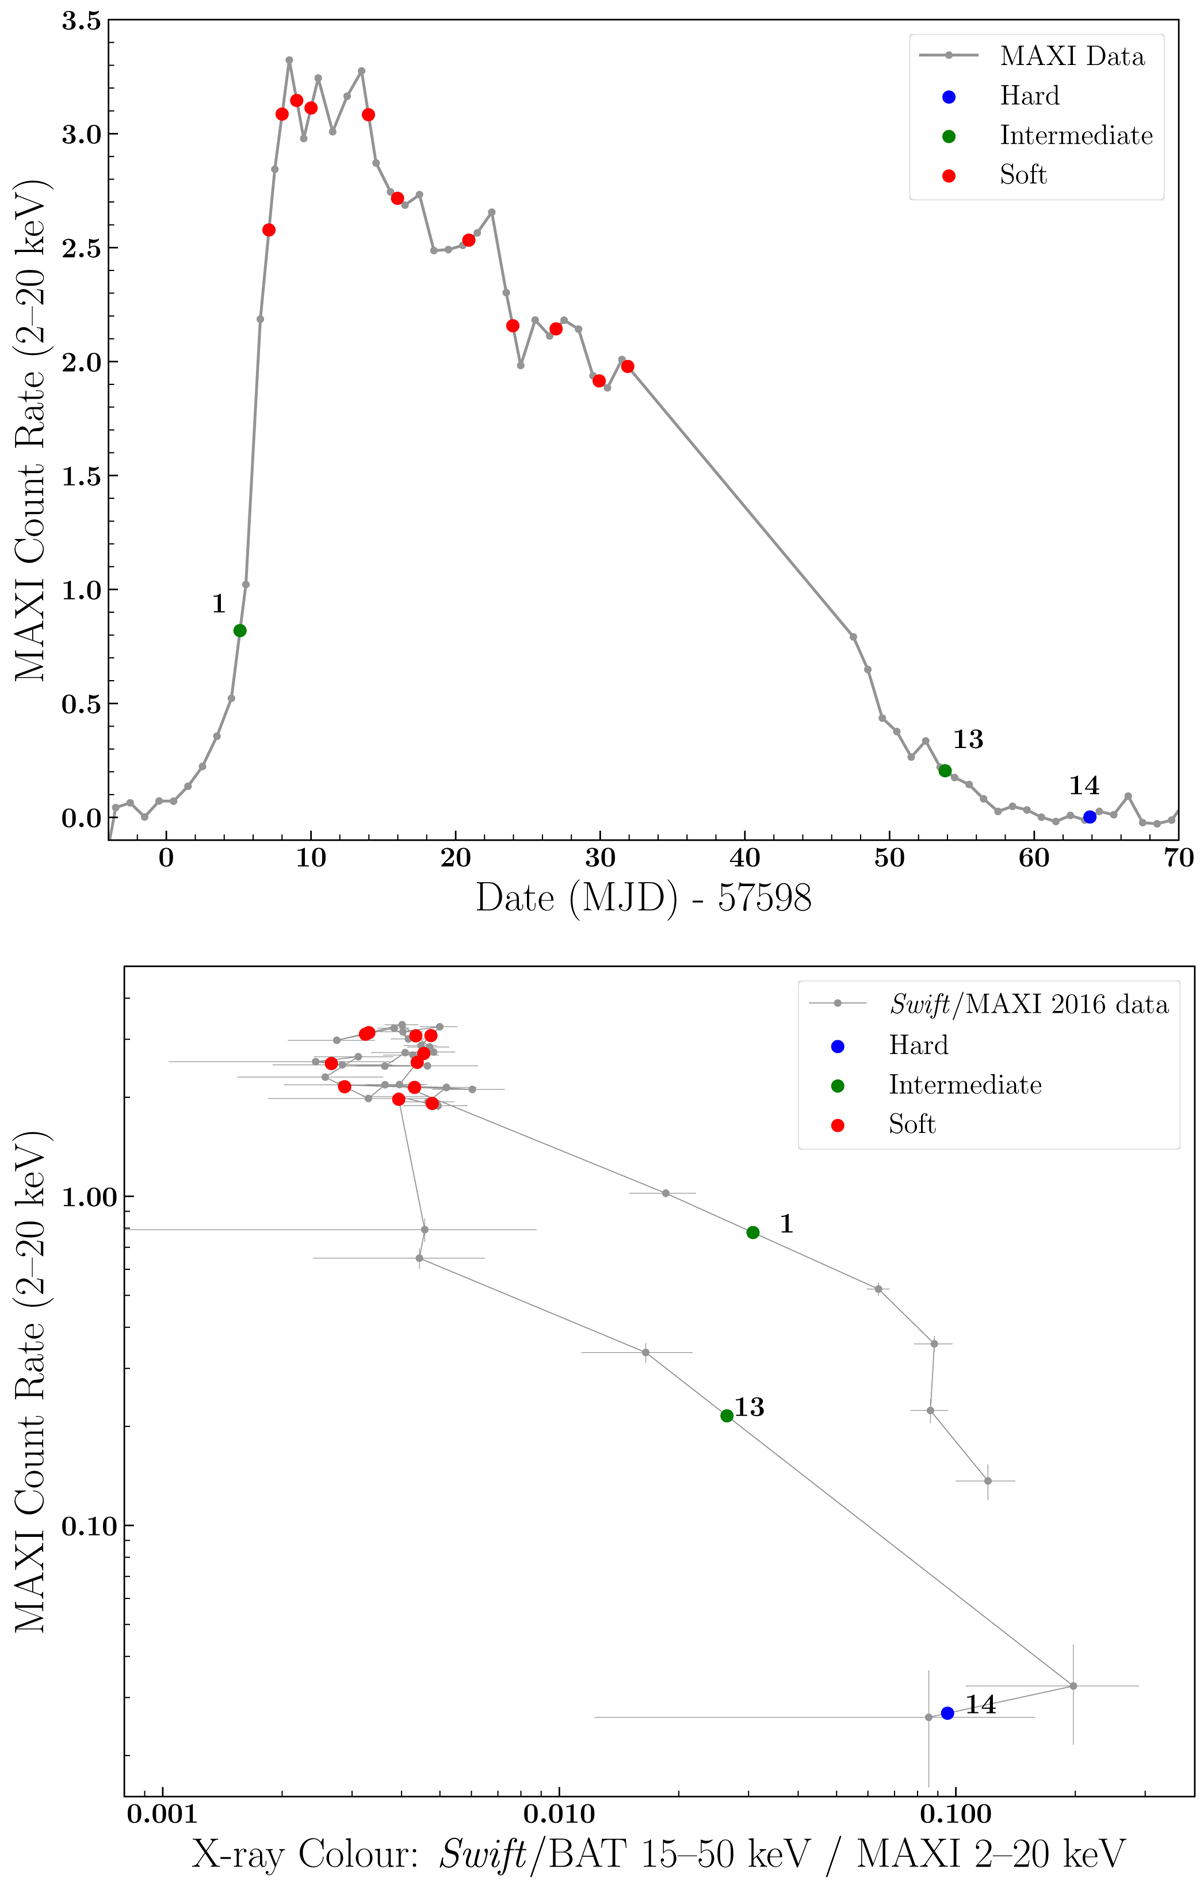
Light curve and HID of Aql X-1 during its 2016 outburst. Grey dots represent the X-ray data, while the larger dots (coloured according to the X-ray state; see legend), mark the interpolated position for each GTC epoch. Epochs #1, #13, and #14 are marked with numbers. Upper pannel: light curve from MAXI (2–20 keV). Bottom pannel: HID obtained by using Swift/BAT (15–50 keV; hard band) and MAXI (2–20 keV; soft band), starting on MJD 57598. We only considered count rates exceeding 0.0022 photons cm−2 s−1 (MAXI) and 0.01 counts cm−2 s−1 (Swift/BAT). The source displays the usual hysteresis loop in the anticlockwise direction.
Current usage metrics show cumulative count of Article Views (full-text article views including HTML views, PDF and ePub downloads, according to the available data) and Abstracts Views on Vision4Press platform.
Data correspond to usage on the plateform after 2015. The current usage metrics is available 48-96 hours after online publication and is updated daily on week days.
Initial download of the metrics may take a while.