Fig. A.1.
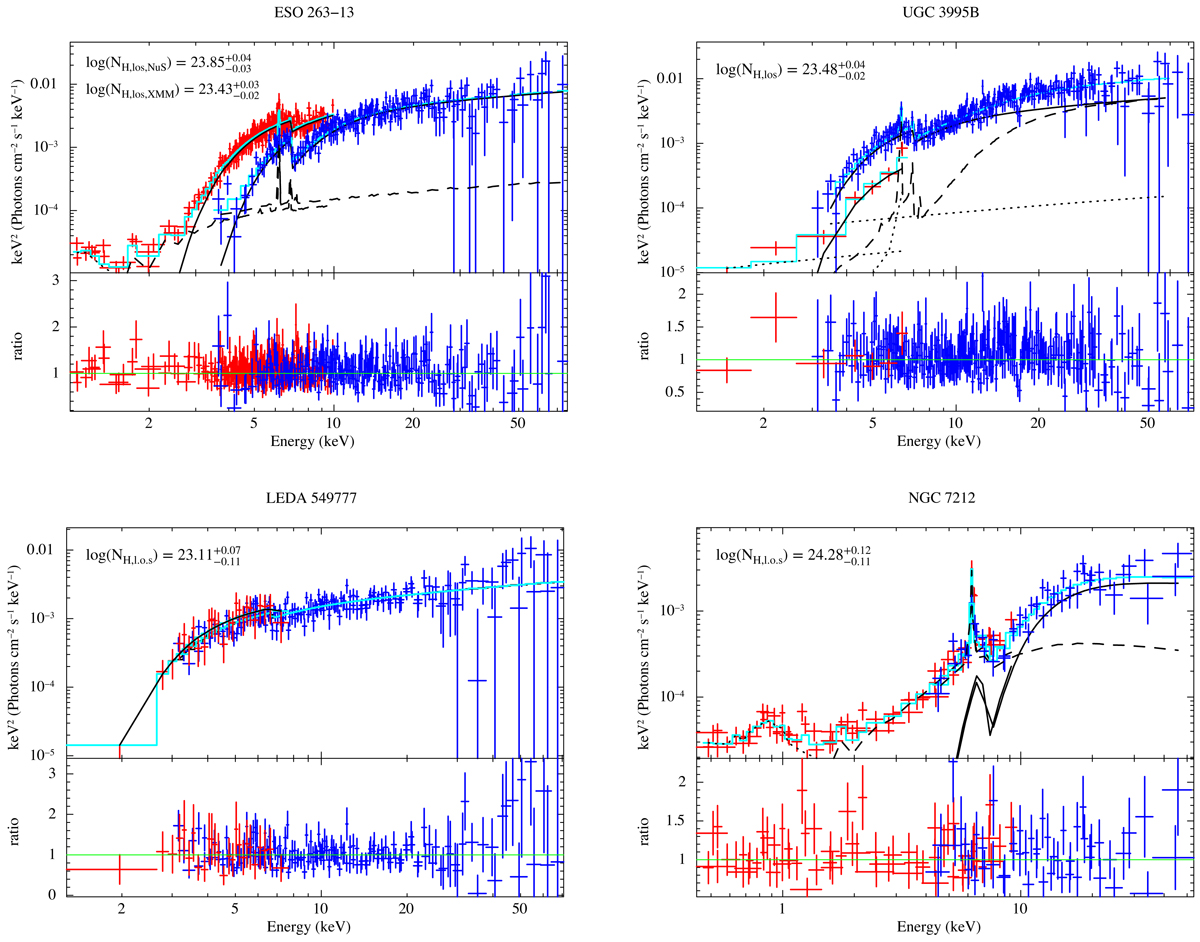
Spectra and ratio (between the data and model predictions) of ESO 263-13 (XMM-Newton+NuSTAR), UCG 3995B (Chandra+NuSTAR), LEDA 549777 (Swift-XRT+NuSTAR) and NGC 7212 (in M19 sample). NuSTAR and soft X-ray data are plotted in blue and red, respectively. The total best-fit model predictions and different components of the models of are plotted in cyan and black, respectively. The reprocessed component, line-of-sight component, and scattered (and Mekal) component are plotted in dashed, solid, and dotted lines, respectively. Significant flux variabilities are found in ESO 263-13 and UGC 3995B.
Current usage metrics show cumulative count of Article Views (full-text article views including HTML views, PDF and ePub downloads, according to the available data) and Abstracts Views on Vision4Press platform.
Data correspond to usage on the plateform after 2015. The current usage metrics is available 48-96 hours after online publication and is updated daily on week days.
Initial download of the metrics may take a while.