Free Access
Fig. 3.
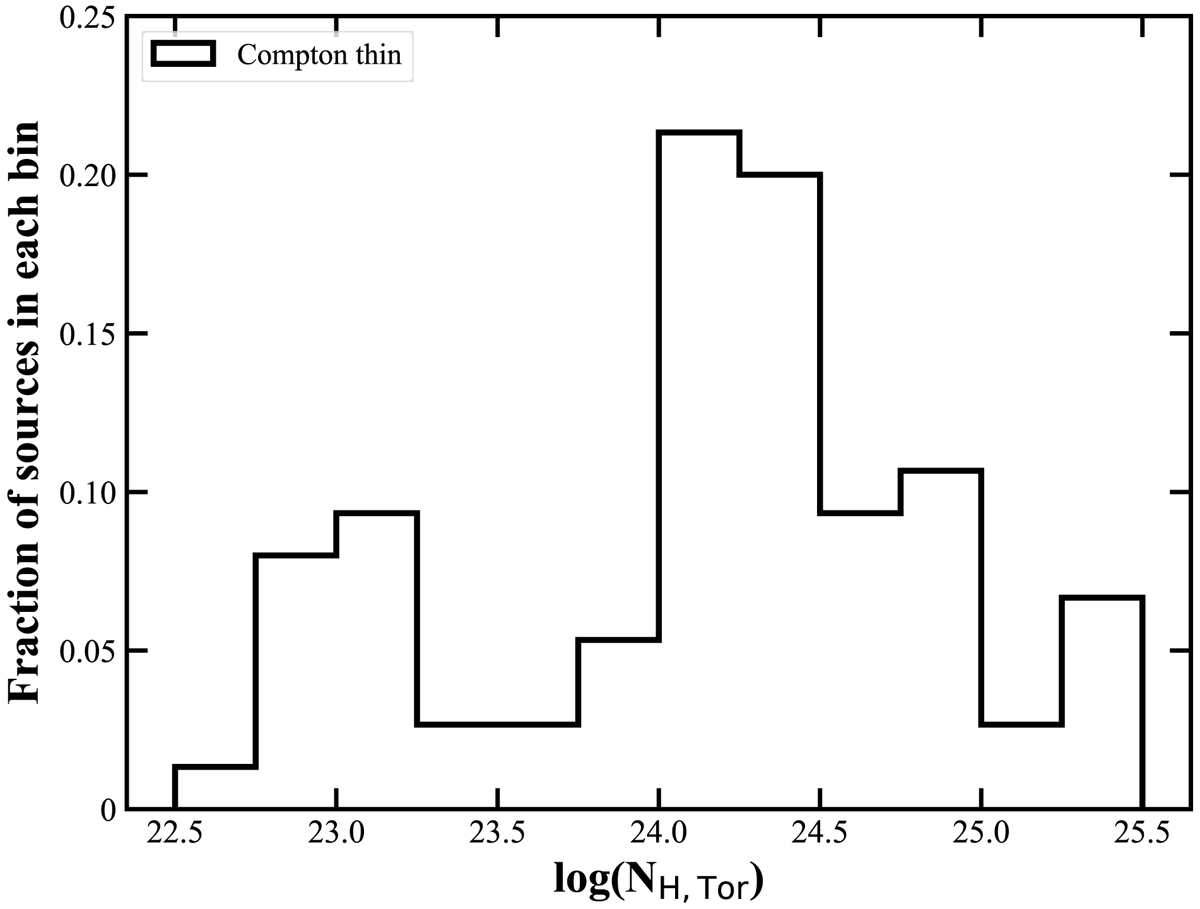
Distribution of the average column density of the tori of the sources in our unbiased Compton-thin AGN sample. The histogram describes the same sample as in the upper right panel of Fig. 1 but with different grouping bins.
Current usage metrics show cumulative count of Article Views (full-text article views including HTML views, PDF and ePub downloads, according to the available data) and Abstracts Views on Vision4Press platform.
Data correspond to usage on the plateform after 2015. The current usage metrics is available 48-96 hours after online publication and is updated daily on week days.
Initial download of the metrics may take a while.