Fig. 2.
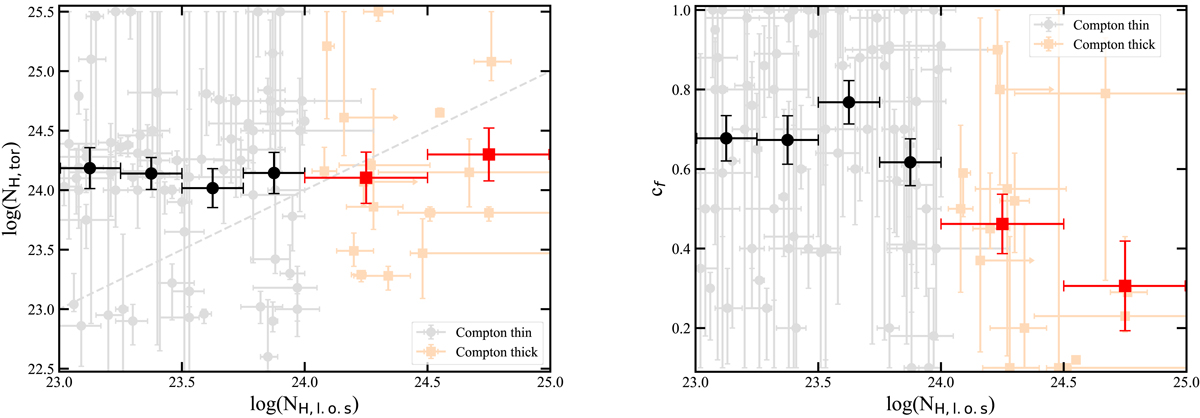
Torus column density log(NH,tor) (left) and torus covering factor cf (right) as a function of line-of-sight column density, log(NH,los). Compton-thin sources are plotted in light gray points, while CT sources are plotted in light red squares. The average and 1σ standard error of the torus column densities and torus covering factors in different line-of-sight column density bins are plotted in black points for Compton-thin sources and red squares for CT sources, respectively. Left panel: NH,tor = NH,los is plotted as a light-gray dashed line. The low covering factors of the CT sources are due to the bias explained in Sect. 3.
Current usage metrics show cumulative count of Article Views (full-text article views including HTML views, PDF and ePub downloads, according to the available data) and Abstracts Views on Vision4Press platform.
Data correspond to usage on the plateform after 2015. The current usage metrics is available 48-96 hours after online publication and is updated daily on week days.
Initial download of the metrics may take a while.