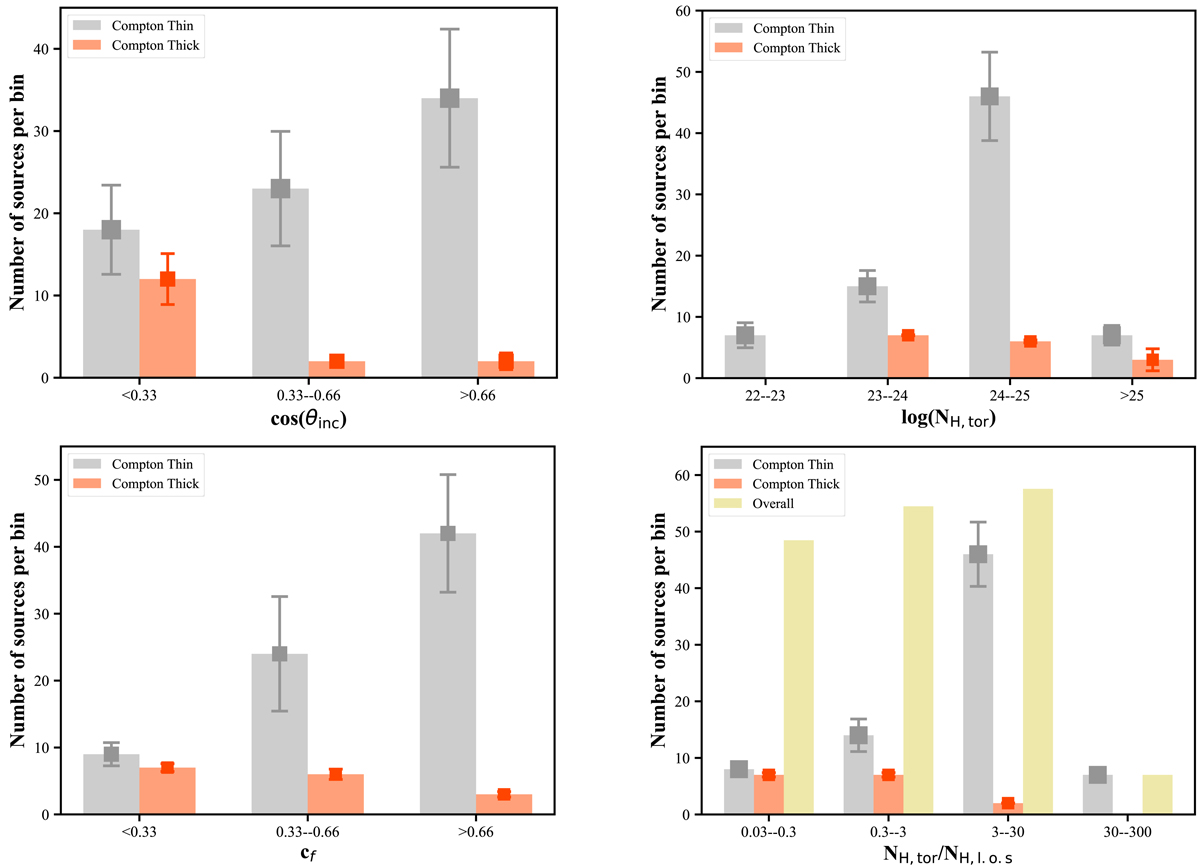
Fig. 1.

Left to right in the first row and second row: number of sources with a specific range of inclination angles, cos(θinc), torus column densities, log(NH,tor), torus covering factors, cf, and torus column density contrast ratios, NH,tor/NH,los, from the Compton-thin sources in our sample (gray histogram) and CT sources from M19 (orange histogram), respectively. cos(θinc)∼0.05 is when the AGN is observed edge-on and cos(θinc)∼0.95 is when the AGN is observed face-on. The error bar is at 90% confidence level. The overall distribution of the torus column density contrast ratio after rescaling is plotted in yellow. We do not include the 15 sources fitted with only a line-of-sight component and a scattered component here.
Current usage metrics show cumulative count of Article Views (full-text article views including HTML views, PDF and ePub downloads, according to the available data) and Abstracts Views on Vision4Press platform.
Data correspond to usage on the plateform after 2015. The current usage metrics is available 48-96 hours after online publication and is updated daily on week days.
Initial download of the metrics may take a while.


