Fig. 5
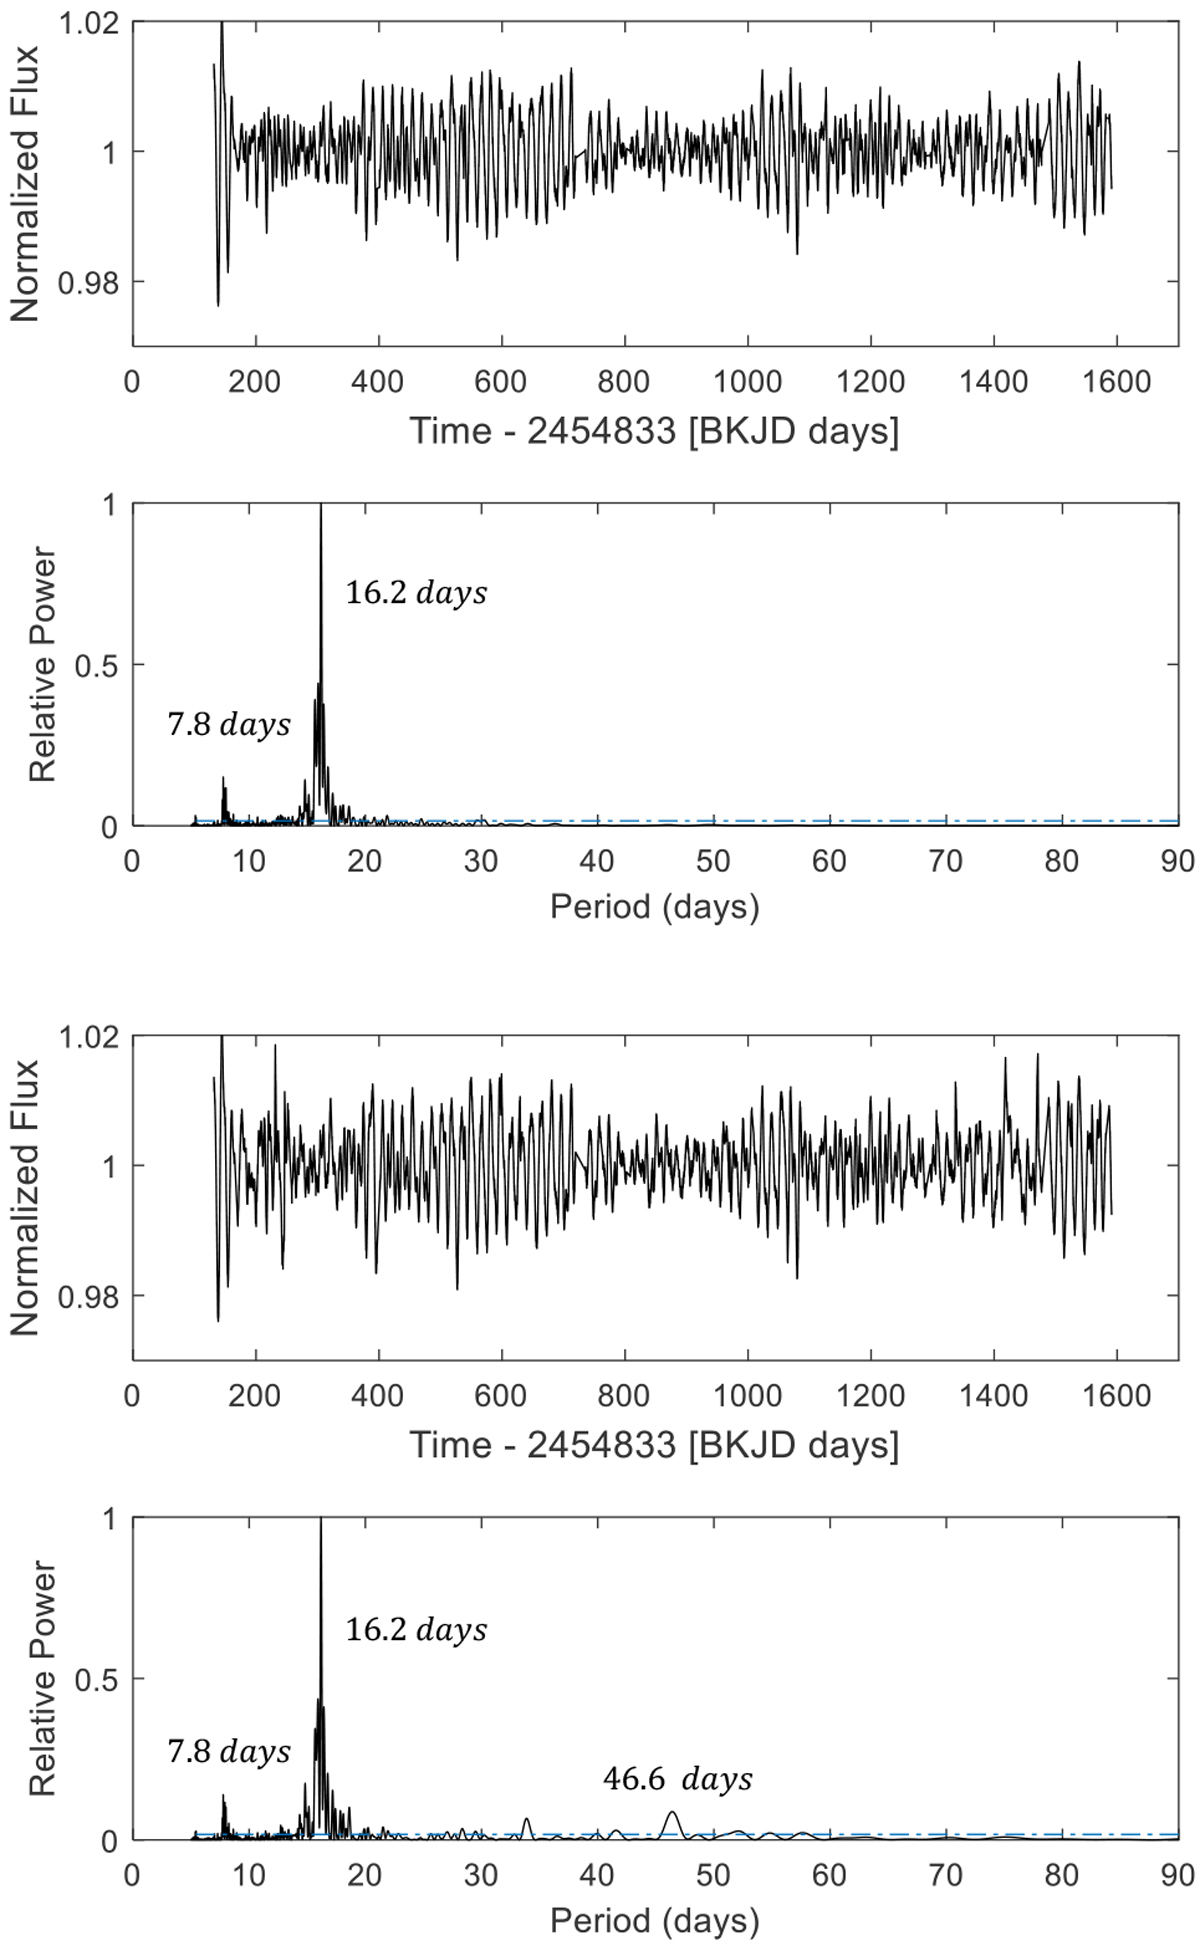
Final PDC (first panel) and SAP (third panel) time-series adjusted according to the steps of Sect. 3. The corresponding Lomb–Scargle periodograms are shown at the bottom. The dashed-dotted blue line marks the 99% confidence level. For SAP data, there is a significant peak to 46.6 days also found in Fig. 6. As can be seen, the PDC time-series has a flat periodogram for periods longer than 20 days confirming that the PDC pipeline tends to remove all the long-term trends.
Current usage metrics show cumulative count of Article Views (full-text article views including HTML views, PDF and ePub downloads, according to the available data) and Abstracts Views on Vision4Press platform.
Data correspond to usage on the plateform after 2015. The current usage metrics is available 48-96 hours after online publication and is updated daily on week days.
Initial download of the metrics may take a while.