Fig. A.1
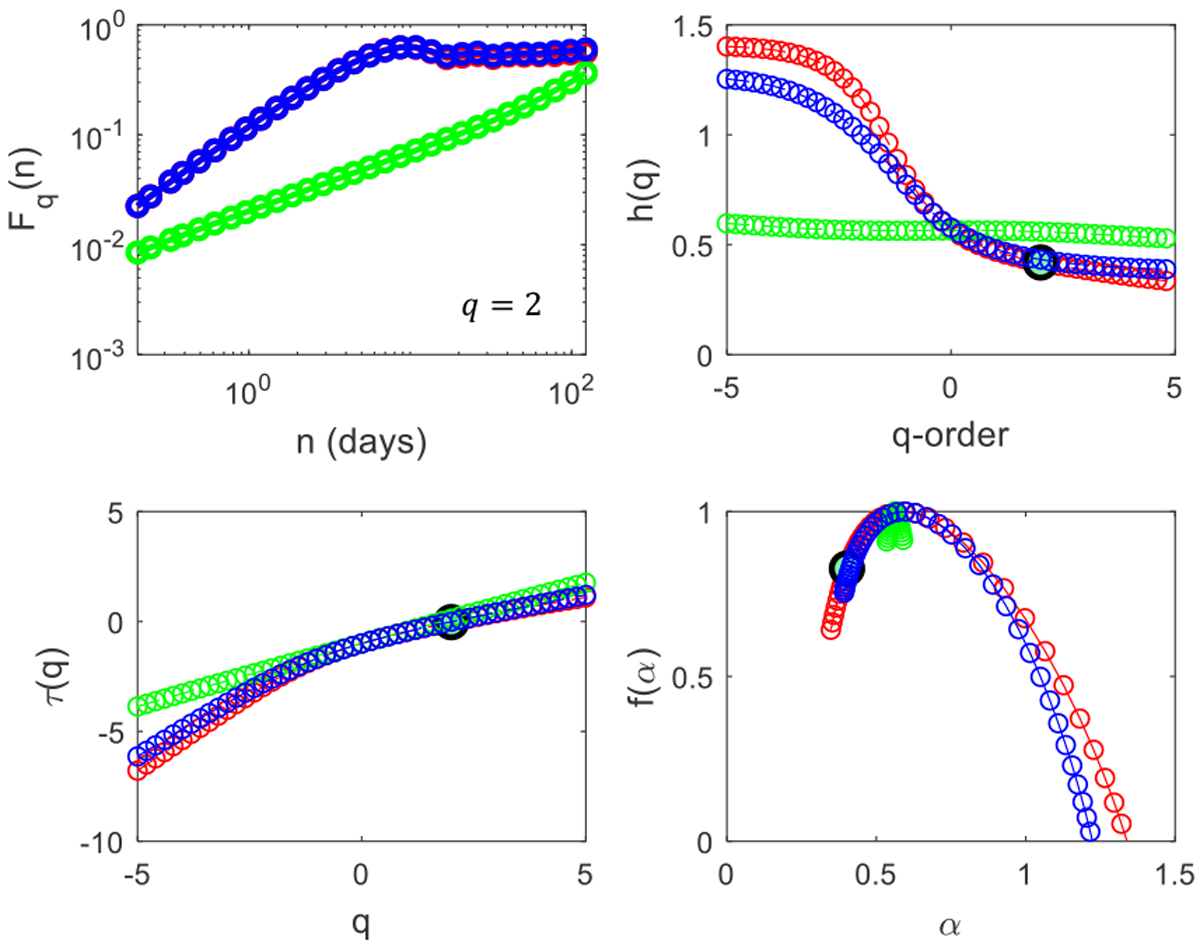
Multifractal analysis for PDC time-series following steps 5 and 6 presented in Sect. 4. Top panel: original (in red), shuffled (green), and phase-randomised (blue) data are based on the procedure mentioned in Sect. 4. Left top: multifractal fluctuation function Fq (n) obtained from MFDMA method for only q = 2, indicated henceforth as a big circle. Right top: q-order Hurst exponent (h(q)) as a functionof q-parameter. This panel shows the truncation originated from the leveling of the h(q) for positive q. Left bottom: comparison of the multifractal scaling exponent τ(q) of three data. In this panel, it is possible to identify a crossover in q ~−1. Right bottom: multifractal spectrum f(α) of three time-series, respectively.
Current usage metrics show cumulative count of Article Views (full-text article views including HTML views, PDF and ePub downloads, according to the available data) and Abstracts Views on Vision4Press platform.
Data correspond to usage on the plateform after 2015. The current usage metrics is available 48-96 hours after online publication and is updated daily on week days.
Initial download of the metrics may take a while.