Free Access
Fig. 17
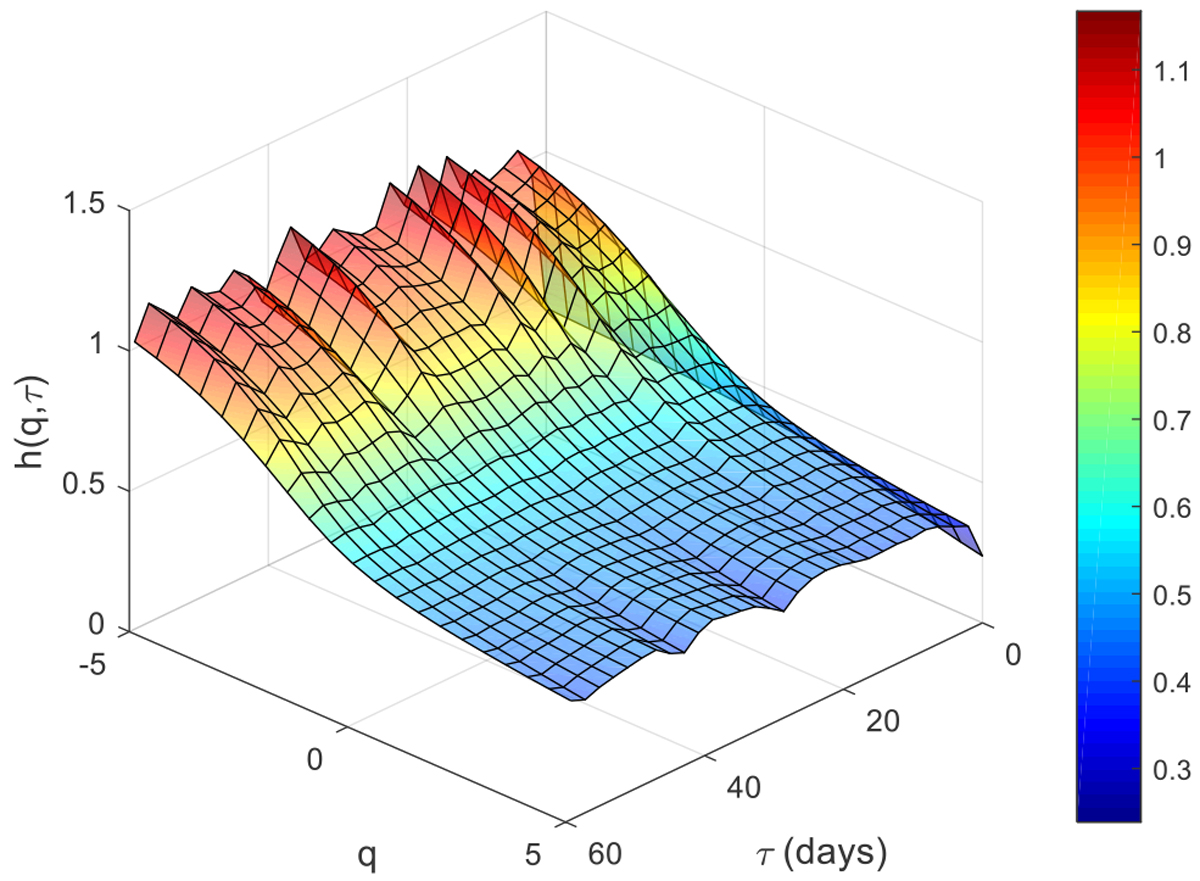
Hurst surface h(q, τ) calculated for final PDC time-series. The (h, q) plane corresponds to h(q) calculated with the standard MFDMA method. The colour bar indicates values of h(q, τ), where for q < 0 the higher values are found and for q > 0 the lower ones.
Current usage metrics show cumulative count of Article Views (full-text article views including HTML views, PDF and ePub downloads, according to the available data) and Abstracts Views on Vision4Press platform.
Data correspond to usage on the plateform after 2015. The current usage metrics is available 48-96 hours after online publication and is updated daily on week days.
Initial download of the metrics may take a while.